
Figures & data
Table 1. Proximate composition of the camel meat burger replaced with different percentages of CPF, SBF and SMP.
Figure 1. pH values of the camel meat burger incorporated with different percentages of chickpea flour (CPF), soybean flour (SBF), and skimmed milk powder (SMP).
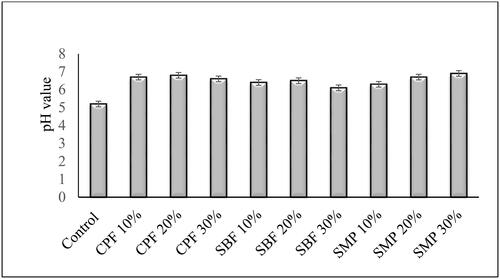
Table 2. Coluor values of the camel meat burgers incorporated with different percentages of CPF, SBF and SMP.
Figure 2. Water holding capacity (WHC) of the camel meat burger incorporated with different percentages of chickpea flour (CPF), soybean flour (SBF), and skimmed milk powder (SMP).
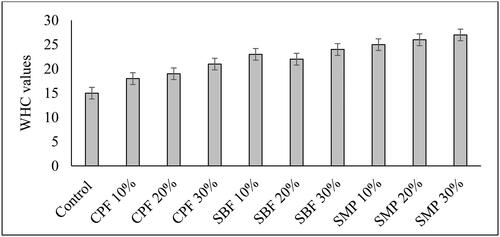
Figure 3. Cooking loss values of the camel meat burger incorporated with different percentages of chickpea flour (CPF), soybean flour (SBF), and skimmed milk powder (SMP).
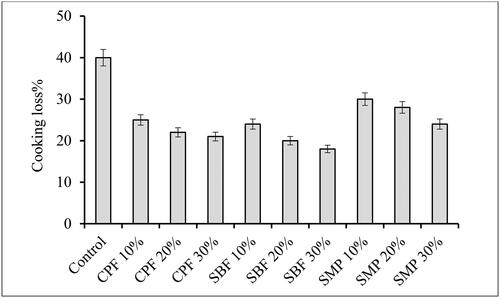
Table 3. Scores of sensory evaluation attributes of the camel meat burger replaced with different percentages of CPF, SBF and SMP.