
Figures & data
Figure 1. Map of Ghana showing the regions and the agroecological zones.
Source: adapted and modified from Hashmiu et al. (Citation2022).
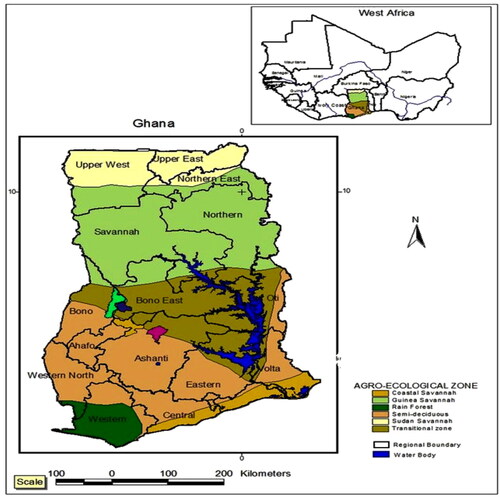
Table 1. Variables and measurement.
Table 2. Summary statistics and test of means of the respondents.
Table 3. Results of logistic regression.
Supplemental material
Public interest statement.docx
Download MS Word (12.7 KB)Data availability statement
Data for the analysis are available from the corresponding author and may be provided on reasonable request.