
Figures & data
Table 1. Summary and test statistics of farmers.
Figure 1. Local polynomial regression result of all households.
Panel 1: Volume of Sesame Harvested vs. Land Planted with Sesame, Panel 2: Productivity of Sesame vs. Land Planted with Sesame for contract farmers.
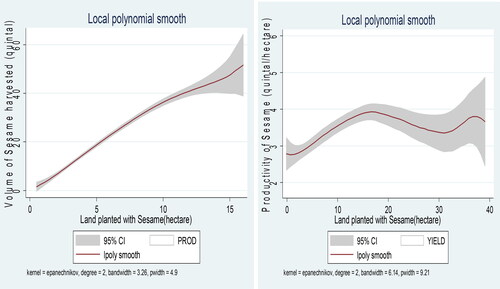
Figure 2. Local polynomial regression result of the two groups.
Panel 3: Productivity of Sesame VS. Farm Size Cultivated by Contract Farmer, Panel 4: Productivity of Sesame VS. Farm Size Cultivated by Non-Contract Farmer.
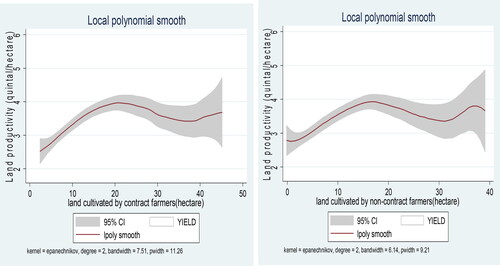
Table 2. Results of matching algorithm.
Table 3. Endogenous switching regression result for contract farming participation.
Table 4. Impact of contract farming on sesame productivity.
Data availability statement
Both authors declare and agreed that data will be made available on request.