
Figures & data
Figure 1. Conceptual framework of the study.
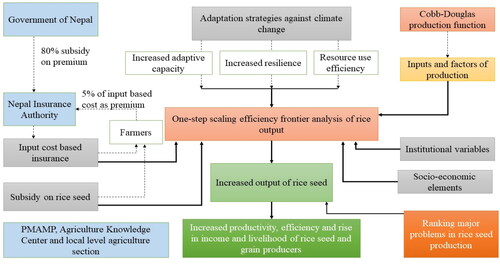
Figure 2. Map of the study area. Source: ArcGIS.
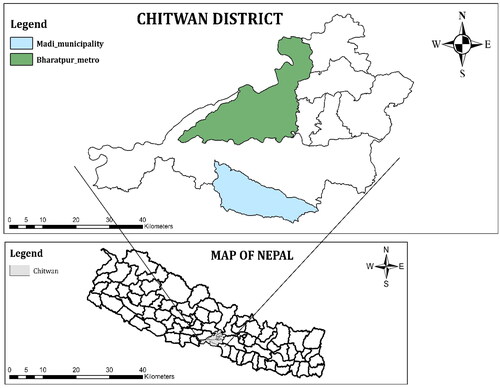
Table 1. List of variables for the efficiency measurement.
Table 2. List of exogenous variables for the inefficiency effect model.
Table 3. Interpretation of the level of productivity (return to scale).
Figure 3. Socio-demographic characteristics of the respondent in Chitwan.
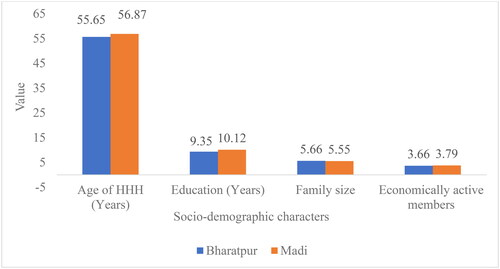
Figure 4. Socio-economic characteristics of the respondent in Chitwan.
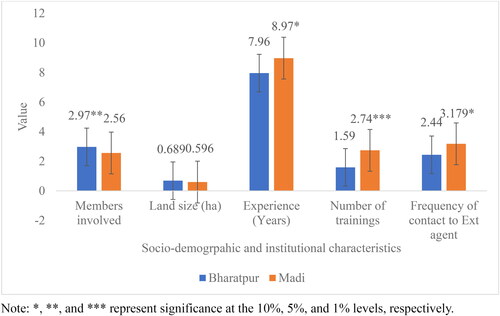
Table 4. Labor, machinery and market availability in the study area.
Table 5. Association among the socio-economic variables with the local levels in Chitwan.
Table 6. Association among the institutional involvement with the local levels of Chitwan.
Table 7. Association of the adoption of crop insurance, climate change adaptation strategies and receipt of subsidy with the local levels of Chitwan.
Figure 5. Genotype of rice seed grown by the rice seed growers in Chitwan.
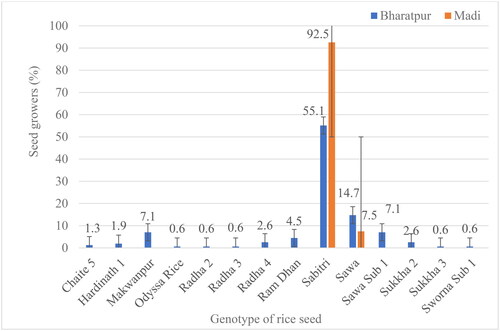
Table 8. Maximum likelihood estimates for Bharatpur from the truncated normal scaling property model.
Table 9. Maximum likelihood estimates for Madi from the truncated normal scaling property model.
Table 10. Technical efficiency (TE) scores of rice seed production in Chitwan.
Table 11. Independent sample t-test for comparison of the mean technical efficiency between the adopters and non-adopters of climate change adaptation strategy in Chitwan.
Table 12. Return to scale for rice seed production in Bharatpur Metropolitan City and Madi Municipality.
Figure 6. Rank of important factors for rice seed production.
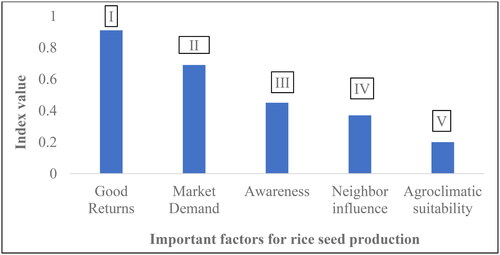
Figure 7. Rank of major problems in rice seed production.
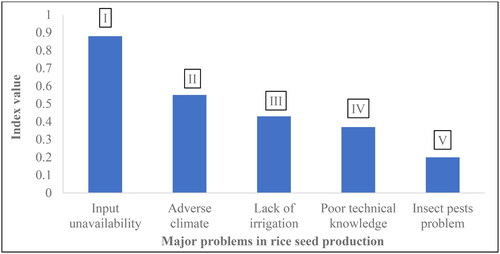
Table A1. Skewness test for confirmation of the presence of inefficiency.
Table B1. Critical values for the mixed chi-square distribution.
Figure C1. Distribution of technical efficiency for Bharatpur and Madi, respectively.
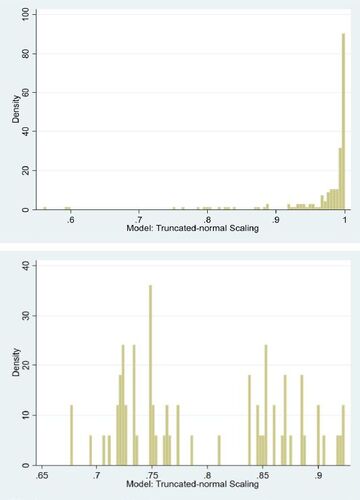
Table D1. Prioritization of the major climate change adaptation strategies in the study area.
Data availability statement
The data that support the findings of this study are available from the corresponding author, Rabin Thapa, upon reasonable request.