
Figures & data
Table 1. Detailed information on all the genotypes used in the current study.
Table 2. Analysis of variance for the marketable yield (q/ha) of twenty-eight genotypes in a multi-environmental evaluation.
Table 3. IPCA scores and environmental means of the marketable yield of twenty-eight genotypes across four locations.
Figure 1. Yield performance of onion genotypes at four different locations.
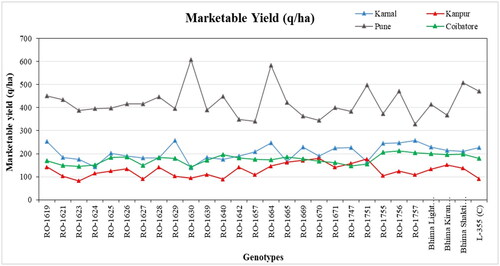
Figure 2. AMM II biplot of the first interaction principal component-I PCA1 × Mean yield of genotypes and environments (Note: 1-Karnal, 2-Kanpur, 3-Pune and 4-Coimbatore).
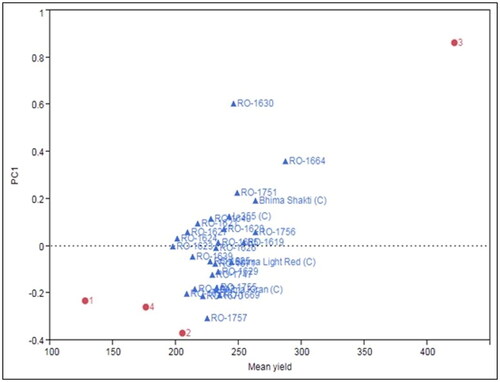
Figure 3. AMMI-II biplots of PCA1, PCA2 and PCA3 (Note: 1-Karnal, 2-Kanpur, 3-Pune and 4-Coimbatore).
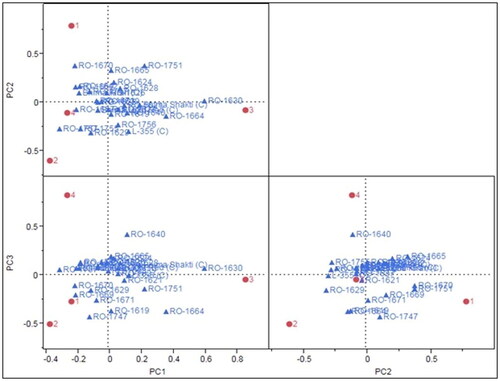
Figure 4. Genotype wise distribution of the AMMI’s stability measure, Wricke’s ecovalence.
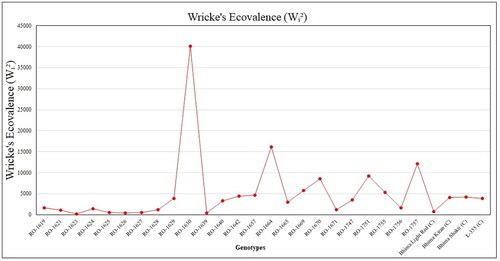
Table 4. IPCA scores, genotype means and Wricke ecovalence of the marketable yield of twenty-eight genotypes across four locations.
Table 5. AMMI stability measures for the 28 onion genotypes.
Figure 5. Dendrogram of 28 onion genotypes based on yield and important yield components using the Euclidean distance coefficient and UPGMA clustering.
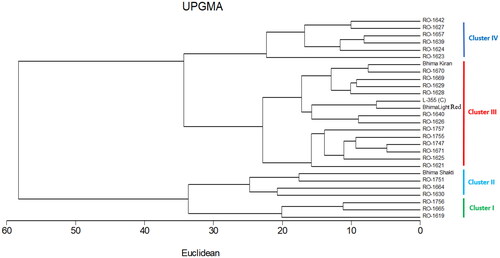
Table 6. Mean performance of genotypes in individual clusters for marketable yield and its component traits.
Supplemental Material
Download MS Word (15.2 KB)Data availability statement
The authors confirm that the data supporting the findings of this study are available within the article [and/or] its supplementary materials.