
Figures & data
Table 1. The number of respondents involved in the present study.
Figure 1. Driving power-dependence matrix.
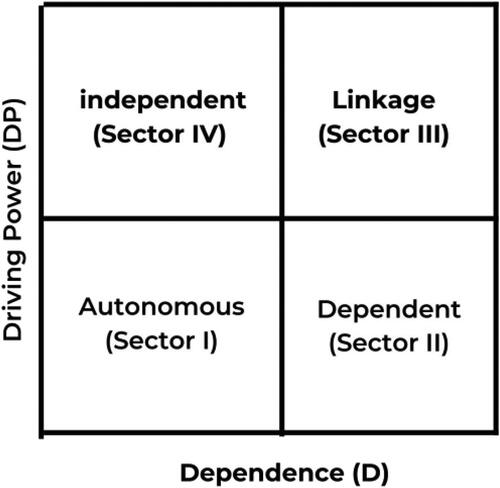
Figure 2. Cartesian diagram (Nasution, Citation2001).
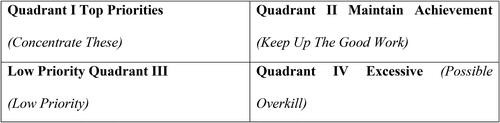
Figure 3. Diagram of the hierarchy of the subelements of the upstream agribusiness subsystem actors in North Toraja Regency.
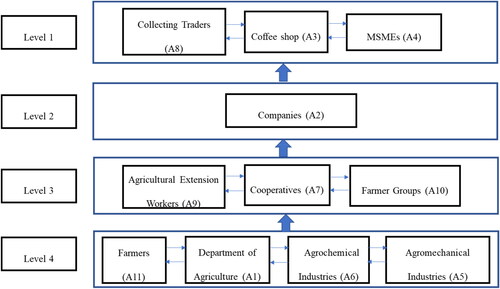
Figure 4. Driving power (DP) and dependence (D) matrix of the upstream agribusiness subsystem actors in North Toraja Regency.
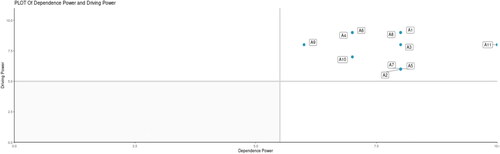
Figure 5. Diagram of the hierarchy of the subelements of the agribusiness subsystem actors in North Toraja Regency.
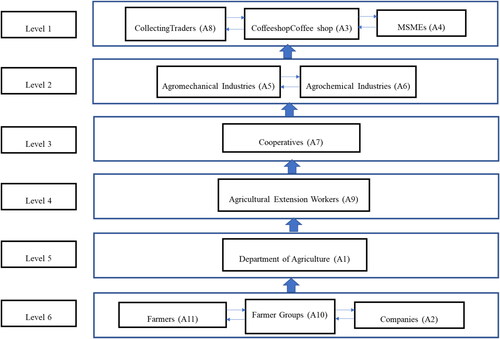
Figure 6. Driving power (DP) and dependency (D) matrix of the elements of the agribusiness subsystem actors in North Toraja Regency.
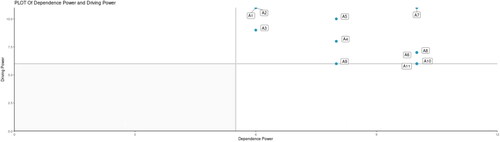
Figure 7. Diagram of the hierarchy of the subelements of the downstream agribusiness subsystem actors in North Toraja Regency.
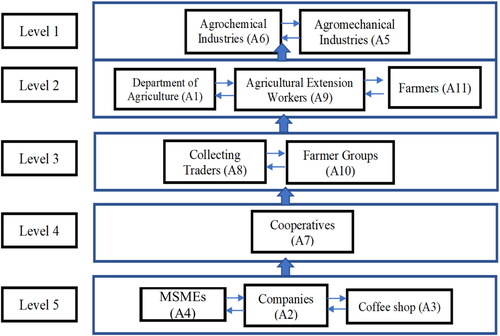
Figure 8. Driving power (DP) and dependence (D) matrix of the downstream agribusiness subsystem actors in North Toraja Regency.
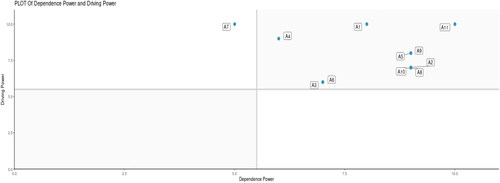
Figure 9. Diagram of the hierarchy of the subelements of the Arabica coffee marketing agribusiness subsystem in North Toraja Regency.
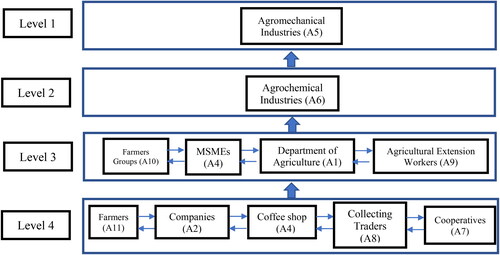
Figure 10. Driving power (DP) and dependence (D) matrix of the subelements of the agribusiness marketing subsystem actors in North Toraja Regency.
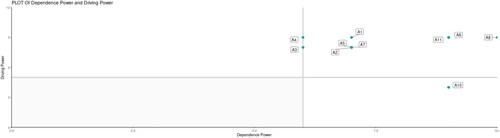
Figure 11. Diagram of the hierarchy of the subelements of the agribusiness subsystem actors supporting Arabica coffee in North Toraja Regency.
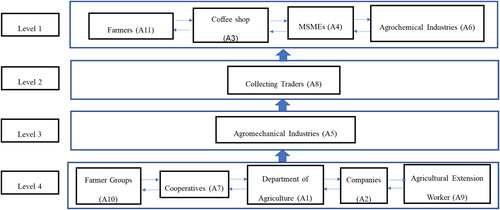
Figure 12. Driving power (DP) and dependency (D) matrix of the supporting agribusiness subsystem actors in North Toraja Regency.
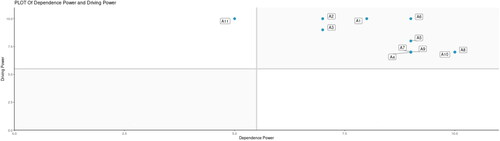
Figure 13. Arabica coffee agribusiness actors in North Toraja Regency.
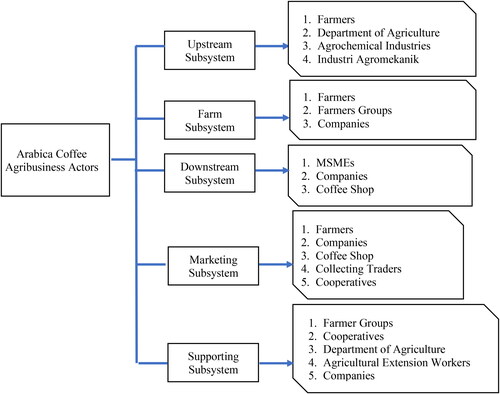
Figure 14. Cartesian diagram of the importance–performance analysis (IPA) results of upstream agribusiness subsystem actors. Note: Quadrant I: High-stake and low performance actors. Quadrant II: High-stake actors and good performance. Quadrant III: Low-stake and low performance actors. Quadrant IV: Low-stake actors and good performance.
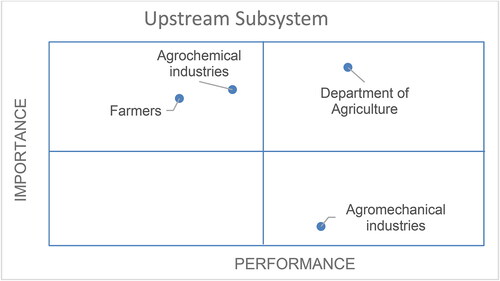
Figure 15. Cartesian diagram of the importance–performance analysis (IPA) results of agribusiness subsystem actors. Note: Quadrant I: High-stake and low performance actors. Quadrant II: High-stake actors and good performance. Quadrant III: Low-stake and low performance actors. Quadrant IV: Low-stake actors and good performance.
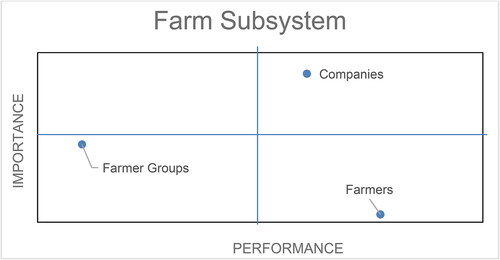
Figure 16. Cartesian diagram of the importance–performance analysis (IPA) results of downstream agribusiness subsystem actors. Note: Quadrant I: High-stake and low performance actors. Quadrant II: High-stake actors and good performance. Quadrant III: Low-stake and low performance actors. Quadrant IV: Low-stake actors and good performance.
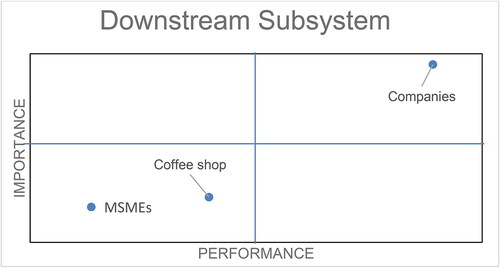
Figure 17. Cartesian diagram of the importance–performance analysis (IPA) results of marketing agribusiness subsystem actors. Note: Quadrant I: High-stake and low performance actors. Quadrant II: High-stake actors and good performance. Quadrant III: Low-stake and low performance actors. Quadrant IV: Low-stake actors and good performance.
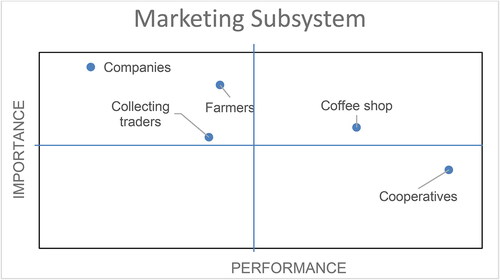
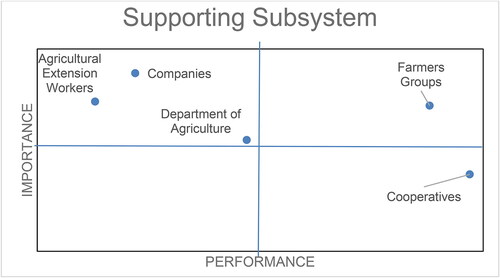
Figure 18. Cartesian diagram of the importance–performance analysis (IPA) results of supporting agribusiness subsystem actors. Note: Quadrant I: High-stake and low performance actors. Quadrant II: High-stake actors and good performance. Quadrant III: Low-stake and low performance actors. Quadrant IV: Low-stake actors and good performance.
Data availability statement
The data that support the findings of this study are available from the corresponding author, [R], upon reasonable request.