
Figures & data
Figure 1. Diagrams showing how the occupancy rate (OR) is calculated for a sire. (a) Basic explanation of common ancestor bull OR calculation. Two examples of pedigree are presented. The males and females are represented by squares and circles, respectively. The blue squares indicate ancestral bulls. The red squares represent the sires for which the OR of the ancestral bull was calculated. (b) Practical explanation of common ancestor bull OR calculation. Males and females are represented by squares and circles, respectively. The red squares represent the sires for which the OR of the ancestral bull was calculated. We calculated the ORs of ancestors A, B, and C using EquationEquation (1)(1)
(1) in the main text.
Theoretically, the sum of ORs can be between 0 and 0.5. If the sum of the ORs was zero, there were no A, B, or C records in the pedigree. If the OR was 0.5, it meant that A, B, or C occupied every male ancestor in the pedigree.
As the great-grandfather of the sire is ancestor A in the example pedigree, we recognize that the sire (red square) belongs to paternal line A. However, in practice, the OR of A is equal to the OR of C and lower than that of B.
 in the main text.Theoretically, the sum of ORs can be between 0 and 0.5. If the sum of the ORs was zero, there were no A, B, or C records in the pedigree. If the OR was 0.5, it meant that A, B, or C occupied every male ancestor in the pedigree.As the great-grandfather of the sire is ancestor A in the example pedigree, we recognize that the sire (red square) belongs to paternal line A. However, in practice, the OR of A is equal to the OR of C and lower than that of B.](/cms/asset/b9614808-cc56-47d3-be42-7b1dc4801b11/oafa_a_2365222_f0001_c.jpg)
Table 1. Summary of the carcass traits of the 308 sire candidates tested.
Table 2. Summary of Wright’s F and ORs of Tajiri, Kedaka, and Fujiyoshi in the sire candidates (n = 308) tested.
Table 3. Pairwise correlations between carcass traits recorded for steers (below diagonal divide) and heifers (above diagonal divide).
Table 4. Effects of ORs of the most prominent paternal ancestors Tajiri, Kedaka, and Fujiyoshi on BMS in JBK sires.
Table 5. Effects of ORs of the most prominent paternal ancestors Tajiri, Kedaka, and Fujiyoshi on CW in JBK sires.
Figure 2. Simulation data of the relationship between beef marbling score (BMS) and carcass weight (CW) vs. Fujiyoshi occupancy rate (OR) (x-axis) and Kedaka OR (y-axis), respectively, when the sum of the three ORs ≤ 0.180, 0.185, 0.190, 0.195, and 0.200.
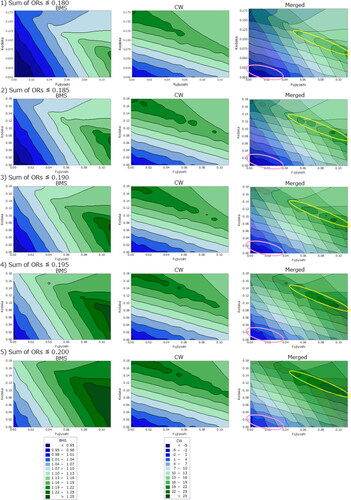
Table 6. Comparative analysis of carcass traits among Tajiri, Kedaka, and Fujiyoshi paternal lines.
Data availability statement
The data that support the findings of this study are available from the corresponding author, HT, upon reasonable request.