
Figures & data
Table 1. KASP SNP markers linked to LLS resistance QTL (qLLSA02) in groundnut.
Figure 1. Genotypic clustering of F2 lines after screening with SNP marker GKAMA02GL582.
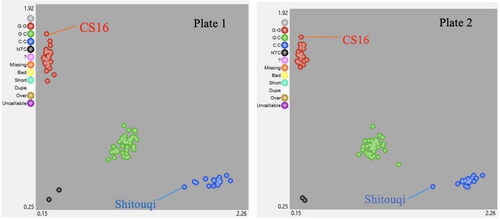
Table 2. Summary statistics for molecular data.
Table 3. Genotype of parents at four loci linked to LLS resistance.
Table 4. Phenotype of genotypic groups.
Figure 2. Regression of three SNP markers on LLS scores. (a) SNP GKAMA02GL829, (b) SNP GKAMA02GL975 (c) SNP GKAMA02GL582.
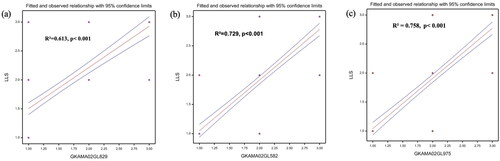
Table 5. Goodness of fit statistics.
Data availability statement
Data will be made available upon reasonable request.