824
Views
4
CrossRef citations to date
0
Altmetric
Research Article

Optoelectronic characterization of Eu3+ doped MLa2O4 (M = Sr, Ca, Mg) nanophosphors for display devices

ORCID Icon, , , & | (Reviewing Editor)
Article: 1104200 | Received 01 Jul 2015, Accepted 28 Sep 2015, Published online: 29 Oct 2015

Figures & data

Figure 1. A schematic presentation for the synthesis of Eu3+-activated MLa2O4 (M = Sr, Ca, Mg) nanophosphors.
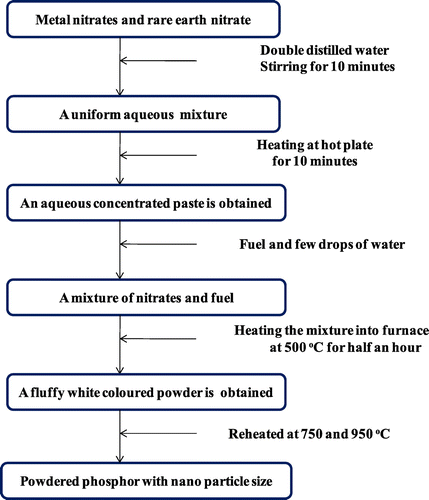
Figure 1. A schematic presentation for the synthesis of Eu3+-activated MLa2O4 (M = Sr, Ca, Mg) nanophosphors.

Figure 2. Photoluminescence spectra of SrLa2O4:Eu3+ excited at 395 nm. (a) Temperature variation (b) Concentration variation.
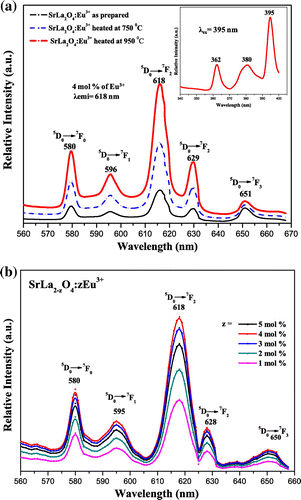
Figure 2. Photoluminescence spectra of SrLa2O4:Eu3+ excited at 395 nm. (a) Temperature variation (b) Concentration variation.

Figure 3. Photoluminescence spectra of CaLa2O4:Eu3+ excited at 395 nm. (a) Temperature variation (b) Concentration variation.
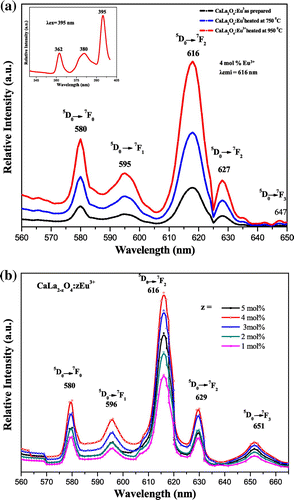
Figure 3. Photoluminescence spectra of CaLa2O4:Eu3+ excited at 395 nm. (a) Temperature variation (b) Concentration variation.

Figure 4. Photoluminescence spectra of MgLa2O4:Eu3+ excited at 395 nm. (a) Temperature variation (b) Concentration variation.
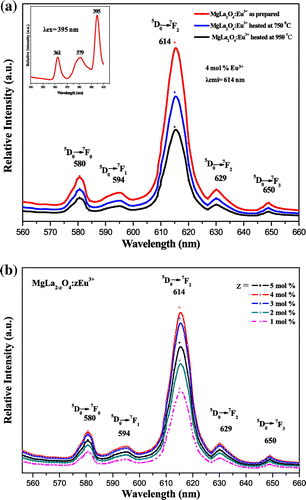
Figure 4. Photoluminescence spectra of MgLa2O4:Eu3+ excited at 395 nm. (a) Temperature variation (b) Concentration variation.

Figure 5. Photoluminescence spectra of La2O3:Eu3+ and MLa2O4:Eu3+ (M = Sr, Ca, Mg) nanophosphor showing variation of metal ions in host lattice.
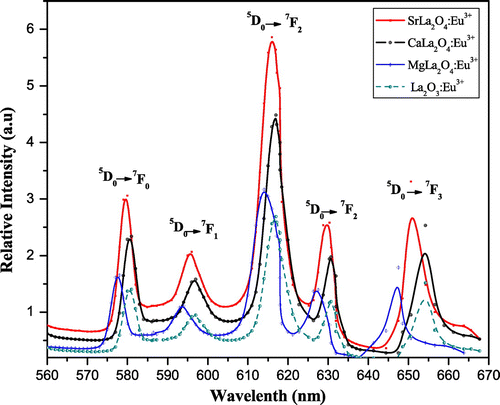
Figure 5. Photoluminescence spectra of La2O3:Eu3+ and MLa2O4:Eu3+ (M = Sr, Ca, Mg) nanophosphor showing variation of metal ions in host lattice.

Table 1. Color co-ordinates of phosphors at varying concentrations and at varying calcination temperatures

Figure 6. Chromaticity diagram of synthesized MLa2O4:Eu3+ (0.04 mol) nanophosphors calcined at 950°C. (a) MgLa2O4:Eu3+ (b) CaLa2O4:Eu3+ (d) SrLa2O4:Eu3+.
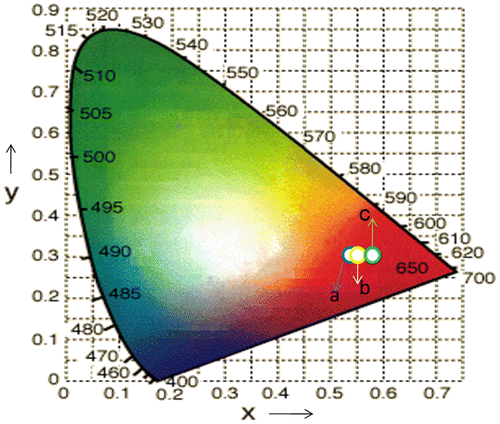
Figure 6. Chromaticity diagram of synthesized MLa2O4:Eu3+ (0.04 mol) nanophosphors calcined at 950°C. (a) MgLa2O4:Eu3+ (b) CaLa2O4:Eu3+ (d) SrLa2O4:Eu3+.

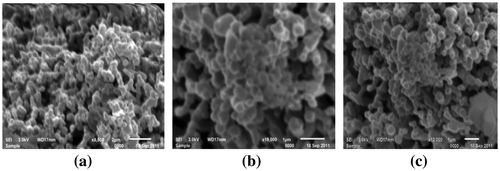
Figure 7. SEM micrograph of (a) SrLa2O4:Eu3+ (b) CaLa2O4:Eu3+ (c) MgLa2O4:Eu3+.

Figure 7. SEM micrograph of (a) SrLa2O4:Eu3+ (b) CaLa2O4:Eu3+ (c) MgLa2O4:Eu3+.

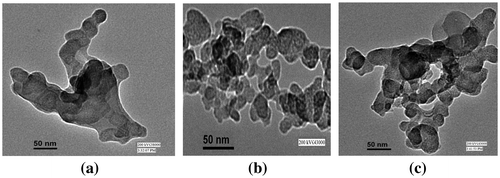
Figure 8. TEM micrograph of (a) SrLa2O4:Eu3+ (b) CaLa2O4:Eu3+ (c) MgLa2O4:Eu3+.

Figure 8. TEM micrograph of (a) SrLa2O4:Eu3+ (b) CaLa2O4:Eu3+ (c) MgLa2O4:Eu3+.

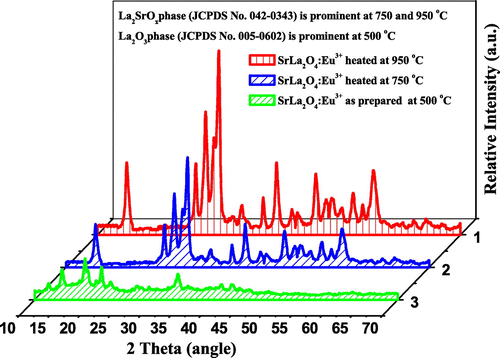
Figure 9. XRD patterns of synthesized SrLa2O4:Eu3+ phosphors.

Figure 9. XRD patterns of synthesized SrLa2O4:Eu3+ phosphors.

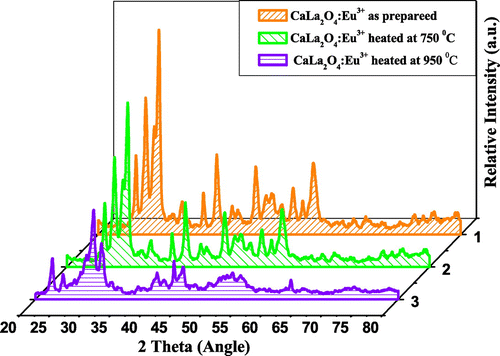
Figure 10. XRD patterns of synthesized CaLa2O4:Eu3+ phosphors.

Figure 10. XRD patterns of synthesized CaLa2O4:Eu3+ phosphors.

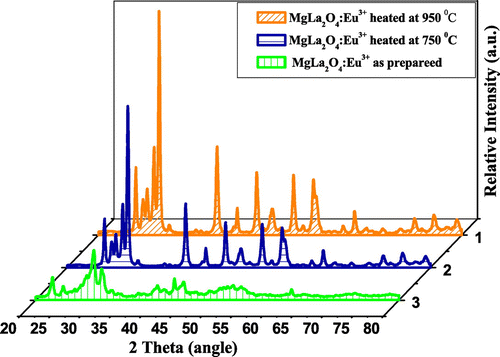
Figure 11. XRD patterns of synthesized MgLa2O4:Eu3+ phosphors.

Figure 11. XRD patterns of synthesized MgLa2O4:Eu3+ phosphors.

Table 2. Detailed description of size and phase of particle of SrLa2O4:Eu3+

Table 3. Detailed description of size and phase of particle of CaLa2O4:Eu3+

Table 4. Detailed description of size and phase of particle of MgLa2O4:Eu3+