Figures & data
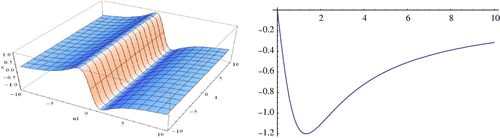
Figure 1. Modulus plot of kink wave shape of when r1 = 1.2, A = C = E = m = 1,
and
.
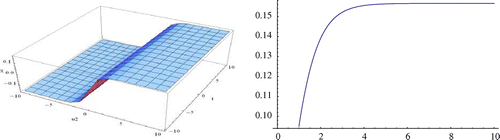
Figure 2. Modulus plot of singular kink wave shape of when r2 = 1.2, A = C = E = m = 1,
and
.
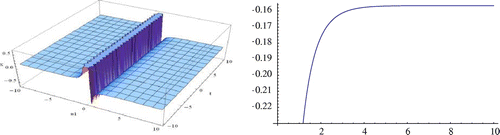
Figure 3. Modulus plot of singular kink wave shape of when r2 = 1.2, C = E = m = 1,
and
.
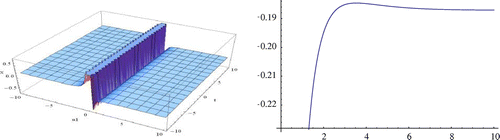
Figure 4. Modulus plot of singular periodic wave shape of when A = 3, r2 = 1.2, C = E = m = B = 1,
and
.
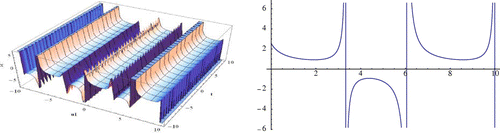
Figure 5. Modulus plot of singular periodic wave shape of when A = 3, r1 = 1.2, C = E
and
.
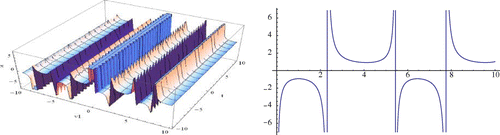
Figure 6. Modulus plot of singular kink wave shape of when A = 3, C = E
and
.
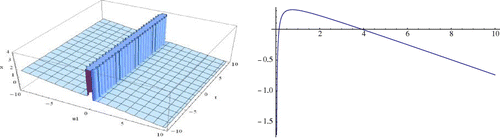
Figure 7. Modulus plot of kink wave shape of when
and
.
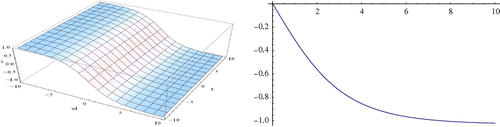
Figure 8. Modulus plot of kink wave shape of when
and
.
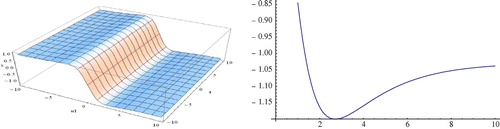
Figure 9. Modulus plot of singular periodic wave shape of when A = 3, r2 = 1.2,
and
.
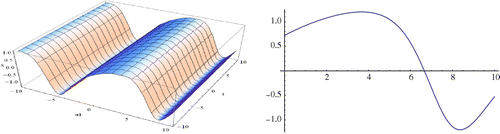
Figure 10. Modulus plot of singular kink wave shape of when A = 3, C = E = m = B = 1,
and
.