Figures & data
Figure 1. Research design: identification of previous research with subsequent data analysis.
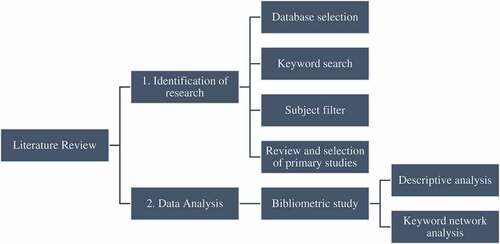
Table 1. Search results from selected keywords on Scopus
Figure 2. Amount and trendline of number of articles published 1987–2017.
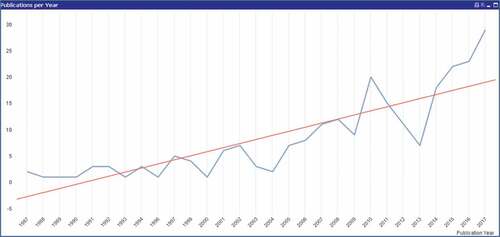
Figure 3. Top 20 keywords in the full sample based on keyword presence.
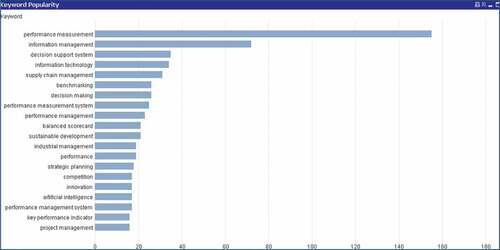
Figure 4. Top 20 keywords that shows the relative use of the main keywords.
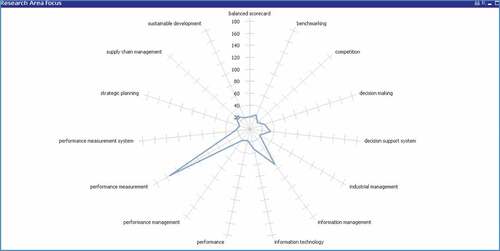
Figure 5. The most used keywords between 2013 and 2018.
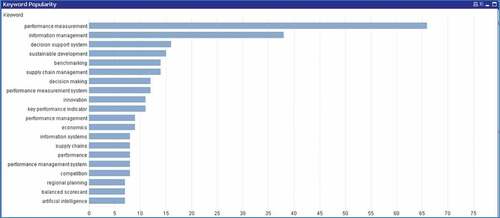
Figure 6. Trends for the most frequent keywords between 2013 and 2018.
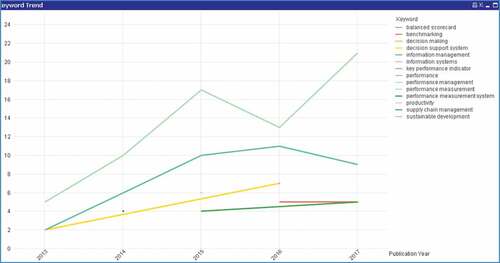
Figure 7. Top 20 journals and conference proceedings.
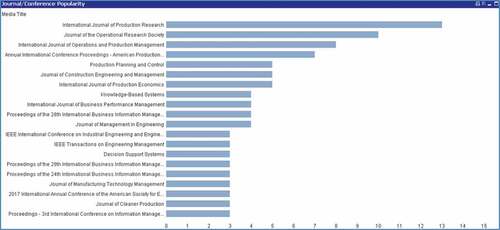
Figure 8. The six most used keywords in the sample (cleared for keywords such as “performance measurement systems” or “performance management”).
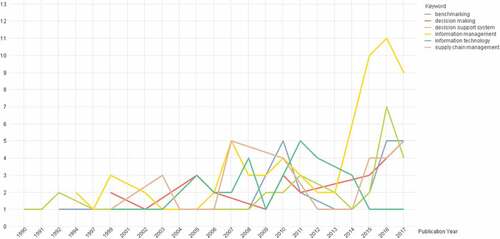
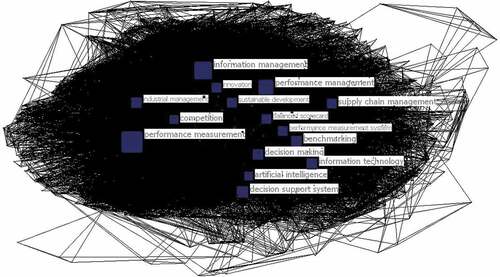
Figure 9. The 15 Keywords with highest normalized degree centrality.
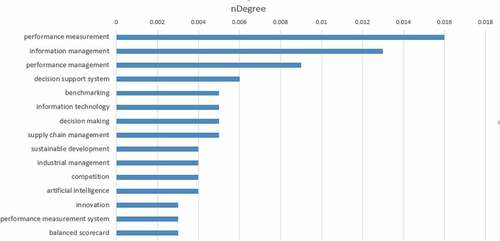
Table 2. Top 15 centrality measures in descending order. 1 means highest degree, 15 means the lowest degree
Table 3. Eigenvector for top 15 keywords
Table 4. Geodesic distance between main topics keywords
Table 5. Main topic keywords centrality by degree and Eigenvector
Table 6. Presents four articles with links between PMS and DC. The linking keyword is “performance measurement” and “dynamic capabilities”
Figure 10. K-core analysis with relations >3 and node size after degree. Five main subgroups identified.
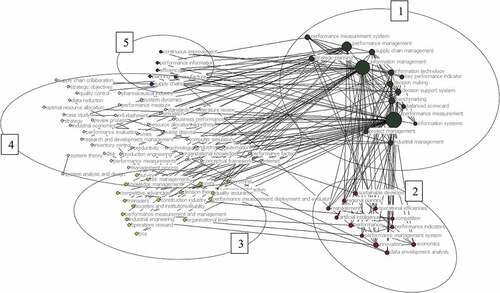
Table 7. Analysis of the potential concept emerging from the subgroups. Group 1 with highest degree centrality
Figure A1. The full network graph with node size after degree and the 15 nodes with highest degree labeled.