
Figures & data
Figure A1. Internet Users in the World by Regions
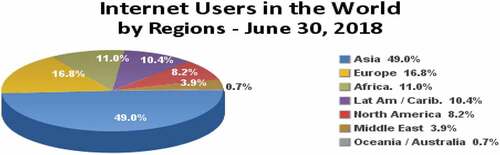
Figure A2. Ghana’s Digital Statistical Indicators
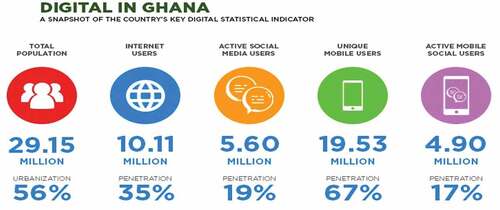
Figure A3. Conceptual Framework
Figure A4. Structural and Measurement Model
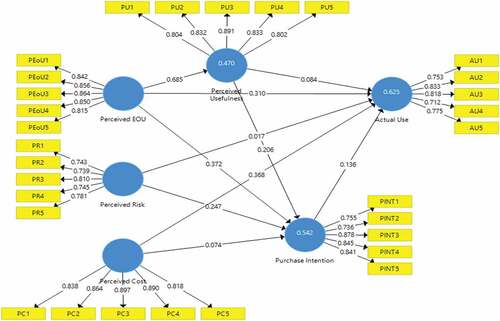
Table A1. Socio-demographic characteristics of respondents
Table A2. Reliability tests
Table A3. Cross loadings
Table A4. Fornell–Larcker test of discriminant validity
Table A5. Heterotrait–Monotrait ratio (HTMT)
Table A6. Collinearity statistic (VIF)
Table A7. Path coefficients
Table A8. Adjusted R-square
Table A9. F-square
Table A10. Construct cross-validated redundancy