
Figures & data
Figure 1. Binomial projection of profits.
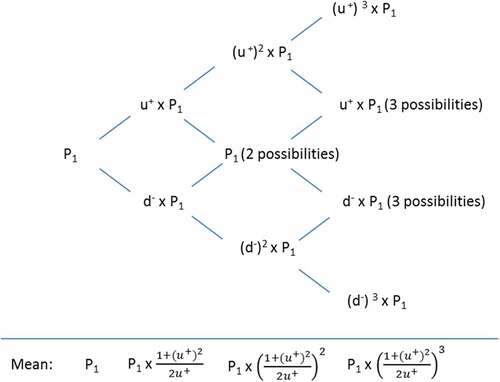
Figure 2. Spreading the carry-over of losses through the following years.
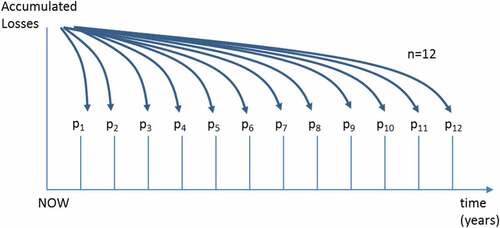
Table 1. Initial conditions
Table 2. Losses, Projected Profits and Valuation of DTA, example 1 (in €), method 1A
Table 3. Losses, projected profits and valuation of DTA, example 2 (in €), method 1A
Table 4. Losses, projected profits and valuation of DTA, example 3 (in €), method 1A
Figure 3. Binomial projection of profits.
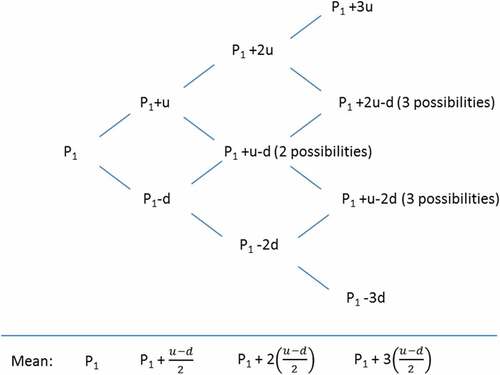
Table 5. Adjustment of negative profits for method 1B
Table 6. Example 1 using method 1B
Table 7. Example 2 using method 1B
Table 8. Losses, Arbitrary Projected Profits and Valuation of DTA, example 4 (in €)
Figure 4. Binomial tree for DTA calculation.
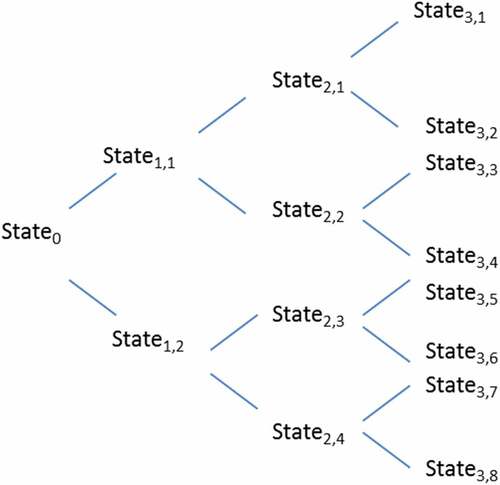
Figure 5. Components of each state in the binomial tree.
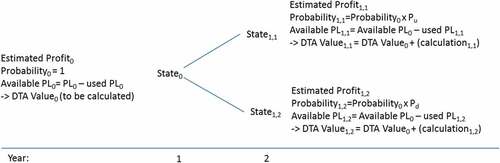
Table 9. Initial conditions used to illustrate the binomial method
Figure 6. Example with state evolution in the binomial tree.
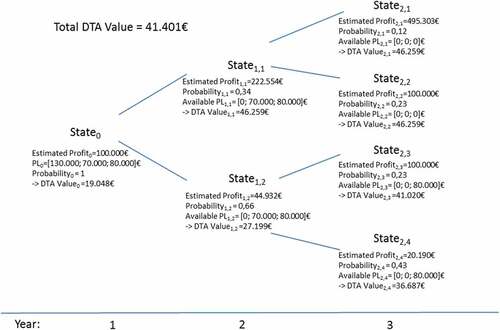
Table 10. Parallelism of same conditions using method 1A (in €)
Figure 7. Example allowing for negative profits, Method 2B.
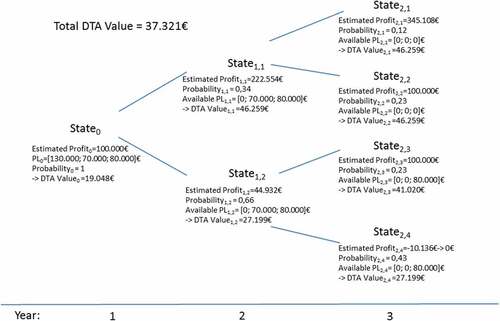
Table 11. Parallelism of same conditions using method 1B (in €)