
Figures & data
Table 1. The list of quantitative variables
Table 2. The list of qualitative variables
Table 3. Univariate analysis and choice of discriminant variables
Table 4. Wilks’ lambda
Table 5. The Confusion matrix
Table 6. Functions at group centroids
Table 7. The classification table
Table 8. The rating grid
Table 9. The probability of default by class
Table 10. Rating of the scoring criteria for credit portfolio managers
Table 11. Weighting of credit portfolio managers as a function of the score
Table 12. The portfolio structure in terms of default
Table 13.. () and (
) by rating class
Table 14. Non-discriminatory variables
Table 15. The quantitative and qualitative discriminating variables
Table 16. Analysis of the correlation of quantitative discriminant variables
Table 17. Results of the Box’s M test
Table 18. Wilks’ lambda
Table 19. The Confusion matrix
Table 20. The canonical correlation of variables
Table 21. The functions at group centroids
Table 22. Rating model based on linear discriminant analysis
Table 23. Explicit estimation of the probability of default by class according to experts
Table 24. Estimate of expected losses by class according to experts
Table 25. The probability of default of the experts retained for the modelling
Table 26. Bayesian rating models
Table 27. The unexpected loss according to the model
Table 28. The Bayesian unexpected loss
Figure 1. Comparison of the performance of correlated variables and
.
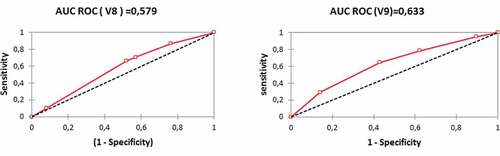
Figure 2. Performance of the linear discriminant analysis model.
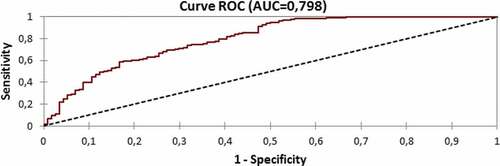
Figure 3. The distribution of healthy and defaulting enterprises and the probability of default by rating class.
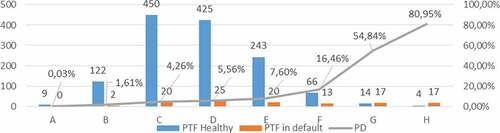
Table A1. Explanation and significance of quantitative variables
Table A2. Explanation and significance of qualitative variables