Figures & data
Figure 1. The model of a solid hardwood supply network is presented with its stakeholders and the material flows between them. There is a direct flow from one entity to all entities in the next tier. The source is the forest department and the sink is the customer of either laminated wood products or for furniture sawn timber.
Figure 2. The process flow chart shows the three main production processes with lamellas (right), sawn timber (middle) and single-layer panel (left). They are connected by four decisions elements which are marked with numbers. At the left, the position of the decoupling point is presented between forecast driven and order driven. Also, the types of decisions are represented with #1 the general decision and #2, #3 and #4 the postponement decisions.
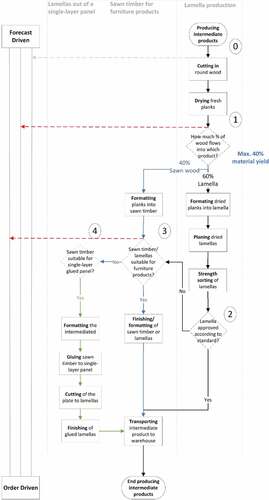
Table 1. Calculated material yields for the two different final products by considering the additional production process flows. The four decisions from the process chart are shown as well as the resulting relative material yields, which are added to the quantity of the end-product
Table 2. The final material outputs resulting from the additional process decisions and SP are displayed. They are printed in bold for the individual SP
Table 3. Material yield and additional cost for the individual SP. For each SP, the material yields for lamellas (product 1) and sawn timber (product 2) are presented in %. From SP 1, the basis policy, the following policies are developed. There are relative cost expenditures for SP 3 and 4
Table 4. Additional expenditures of the alternative production processes are presented depending on the sawmill production capacity in %. This results into a cost span which is shown with min and max values
Table 5. Material performance results of the chosen SP 2, 3 and 4 as well as scenarios 1 to 5 are presented in %
Table 6. Total cost of the chosen SP and scenarios are presented
Table 7. Here the relative-reduced costs per m3 compared to the SP values are alongside the relative additional costs