Figures & data
Figure 1. Coffee production report for eight main countries: 2013–2017 (ICO, Citation2014)
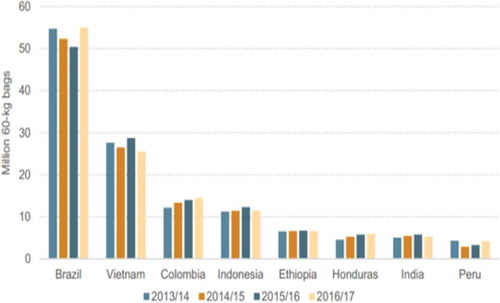
Table 1.: Site selection model summarized information
Figure 2. Location selection model according to (Weber and Moses, Citation2006)
Figure 3. Optimal location selection model (Eldin and Sui, Citation2003)
Figure 4. Framework of research
Figure 5. Methods of data collection by framework developed by (Kumar, Citation2005)
Table 2. Five-point scale Likert’s criterion response
Table 3. Analytic hierarchy process scale values (Alexander, Citation2012)
Table 4. Multi-collinearity test
Table 5. Linear multiple regression model (Model of Fitness)
Figure 6. Dry and wet-processed coffee report (Guji Zone, Citation2013)
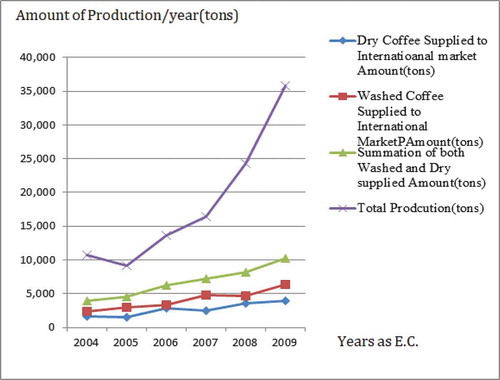
Figure 7. Current trend conceptual framework (field survey)
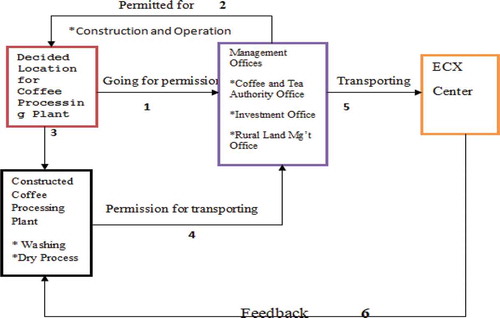
Figure 8. Alternative locations and location factors
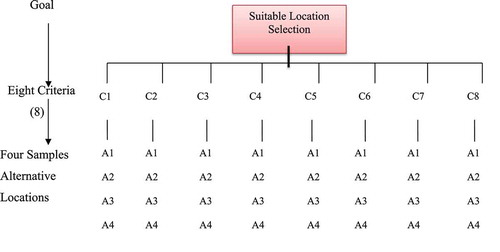
Table 6. Eight location criteria’s and their abbreviations
Table 7. Pair-wise comparison matrix of the criteria or location factors
Table 8. Normalized location criteria
Table 9. Priority vectors after normalized comparisons
Table 10. Potential of coffee production
Table 11. Water priority value with respect to alternatives
Table 12. Land Priority Value With Respect to Alternatives
Table 13. Distance priority value with respect to alternatives
Table 14. Infrastructure priority value with respect to alternatives
Table 15. Labor availability priority value with respect to alternatives
Table 16. Market proximity priority value with respect to alternatives
Table 17. Environmental priority value with respect to alternatives
Table 18. Calculation of priority vector for the entire alternative location and location factors
Table 19. Ranking of alternative locations (source: AHP output)
Figure 9. Proposed model for coffee processing plant location selection