Figures & data
Figure 1. Research model
Note. Dotted line (H6) represents the mediation effect of ad content value moderated by sports influencer credibility.
Table 1. Overview of measurement items and reliability and validity measures
Table 2. AVE, correlations, and squared correlation coefficients
Table 3. Results of process macro (model 4) (n = 298)
Table 4. Results of process macro (model 15) (n = 298)
Figure 2. Moderation effects of sports influencer credibility on ad content value
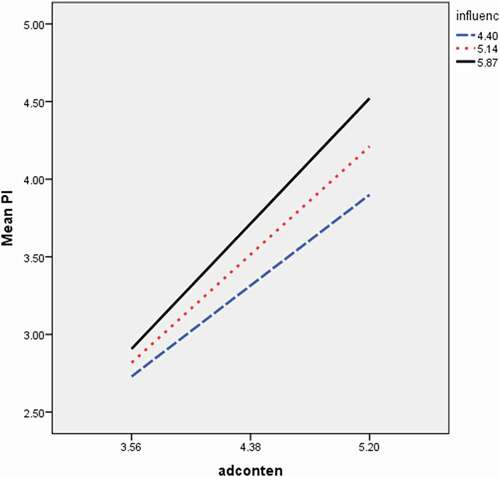
Figure 3. Conditional indirect effects of team identification
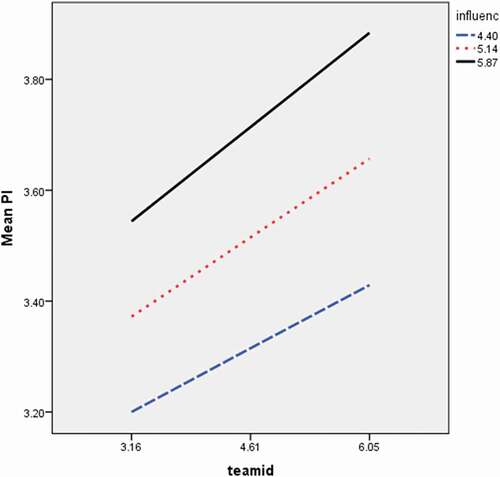
Figure 4. Unstandardized path coefficients for research model
Note. Dotted line (H6) represents the mediation effect of ad content value moderated by sports influencer credibility. Unstandardized path coefficients of H5 and H6 stand for one SD below and one SD above from the mean of sports influencer credibility.