
Figures & data
Figure 1. Characteristics and impact of servant leadership and perceived organizational support its implementation at manufacturing industries(MI) and educational institutions (EI)
Table 1. Sample size
Figure 2. Demographics of the Respondents
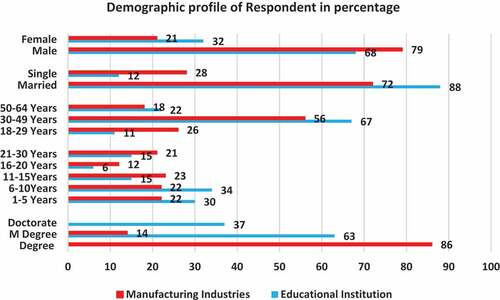
Table 2. Internal reliability of the items- Cronbach’s alpha (α)
Table 3. Sample adequacy Test - Kaiser-Meyer-Okin (KMO) values
Table 4. Independent sample test of servant leadership (SL)
Figure 3. Elucidatory statistics for servant leadership and POS
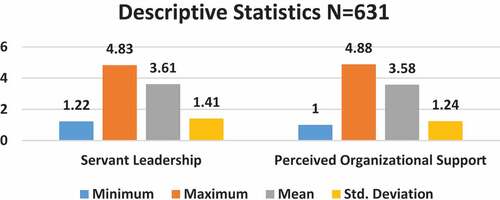
Figure 4. Mean for the samples of the variables at manufacturing industries(MI) and educational institutions (EI)
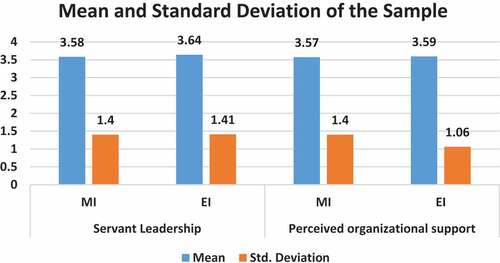
Table 5. Independent sample test of Perceived organizational support (POS)
Table 6. Multiple linear regression analysis of servant leadership