
Figures & data
Figure 1. Conceptual framework of the study.
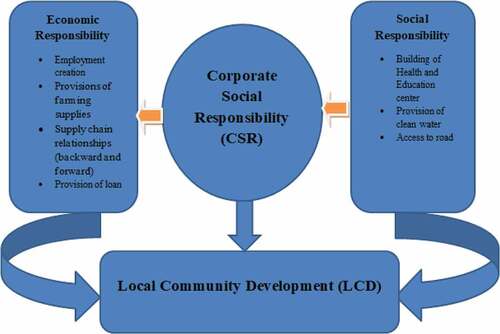
Table 1. The sample respondents allocated for each zone
Figure 2. The histogram for local community development vs residual value
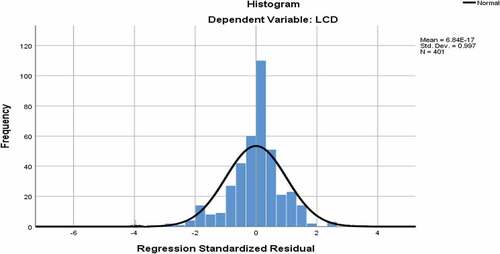
Table 2. Testing for multicollinearity assumption
Figure 3. Respondents length of stay in the study area.
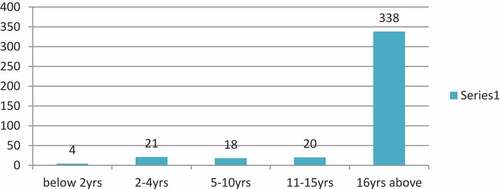
Figure 4. effects of the industries.
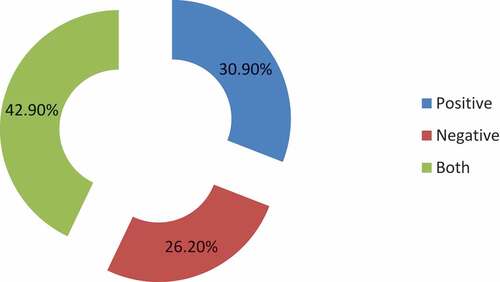
Figure 5. Photo credit during data collection (2021)
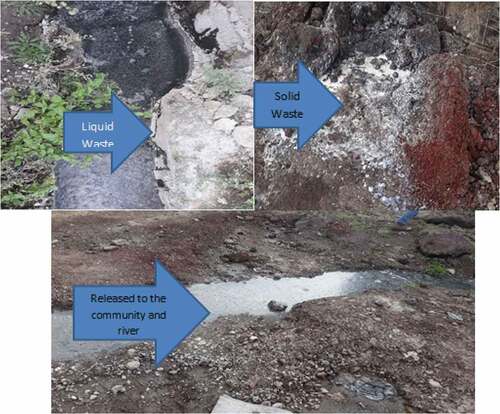
Figure 6. The industry build school for the local community.
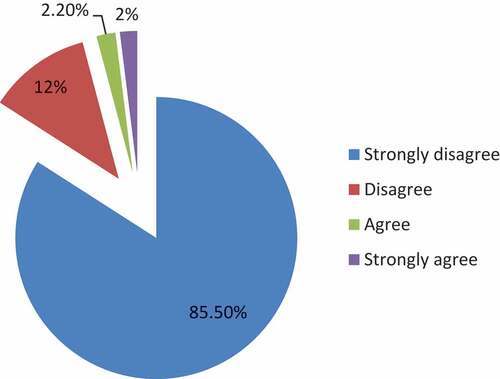
Table 3. The industry has built healthcare centers for the community to promote healthcare delivery
Table 4. The industry provides potable water to the community
Table 5. The manufacturing industry has provided the community with good roads
Table 6. Manufacturing industries/companies and employment creation capacity
Figure 7. Employment creation capacity of Industries (5year Data).
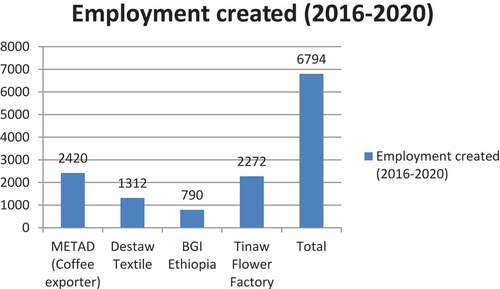
Table 7. Industries support the local community (farmers) with provisions of farming supplies (seeds, pesticides, fertilizer, etc.)
Table 8. The industries support the local community through supply chain relationships (backward and forward)
Figure 8. The manufacturing industry provide loan for local community.
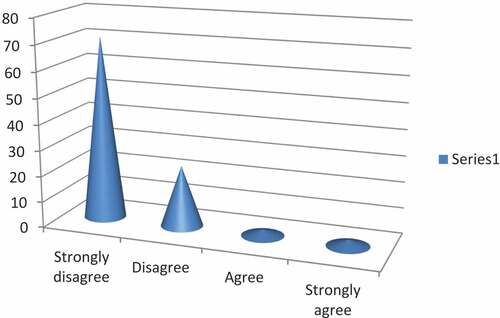
Table 9. The aggregate effect results of Model summary of CSR for community development
Table 10. OLS regression results: The effects of CSR on local community development