Figures & data
Table 1. Descriptive statistics
Table 2. Correlation analysis
Table 3. DCC-GARCH results
Table 4. AG-DCC results
Table 5. Mean differences in DCC-GARCH
Table 6. Granger causality test
Table 7. Hedging effectiveness and diversification ratio
Figure 1. Time-varying correlation of DCC-GARCH—all sample.
Source: Bloomberg, processed.
Figure 2. Time-varying correlation of AG-DCC—all sample.
Source: Bloomberg, processed.
Figure 3. Volatility Spillovers.
Note: the y-axis is the spillover index, the x-axis is the year, and the calculation of volatility spillovers index was done using a 200-week rolling window, a VAR lag length of 5 and 10-day-ahead forecast errors horizon (H =10).Source: Bloomberg, processed.
Table 8. Spillover Connectedness
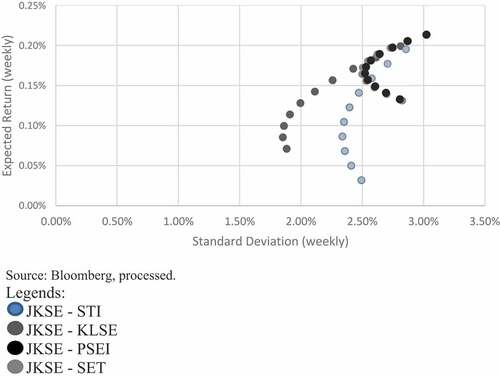
Figure 4. Efficient Frontier.