
Figures & data
Figure 1. Research model.
Table 1. Correlation of organizational commitment statement items (X3)
Table 2. Correlation of managerial performance statement items (Y)
Table 3. Reliability Test Results
Table 4. Equation 1 path analysis results
Table 5. Equation 2 path analysis results
Table 6. T-test coefficient
Table 7. T-test coefficient analysis
Table 8. First equation F-test results
Table 9. The second equation F-test results
Table 10. The results of the coefficient of determination of equation 1
Table 11. The results of the coefficient of determination of equation 2
Table 12. Results of path analysis recapitulation
Table 13. Results of direct, indirect, and total effects
Figure 2. Path analysis results.
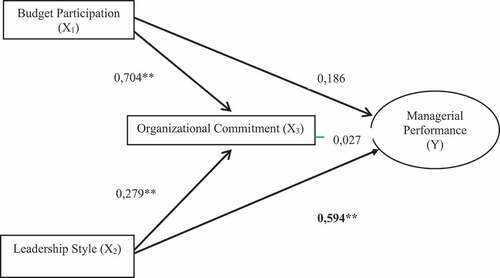
Table A1. Description of respondents by age
Table A2. Classification of respondents by gender
Table A3. Description of respondents by marital status
Table A4. Classification of respondents by education level
Table A5. Classification of respondents by years of service
Table A6. Correlation of Statement Items for Budget participation (X1)
Table A7. Correlation of Leadership Style Statement Items (X2)