Figures & data
Table 1. EC constructs, as represented by the top twenty authors
Figure 1. PRISMA flow diagram.
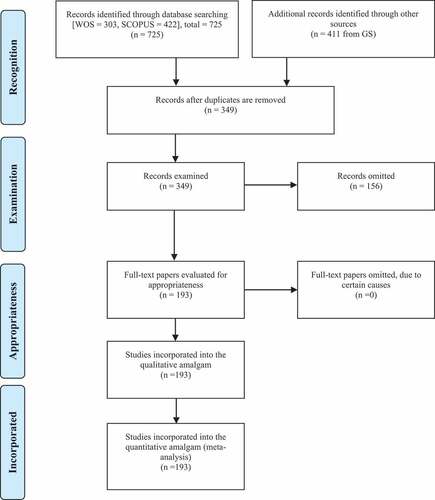
Table 2. Composition of research publications
Figure 2. Documents by year.
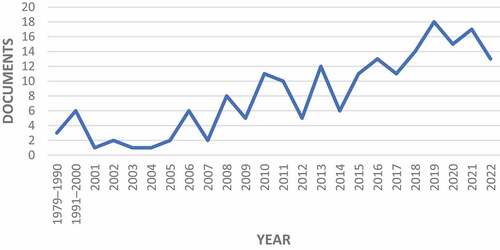
Table 3. Year of publications
Figure 3. Network visualisation map of the citation by countries.
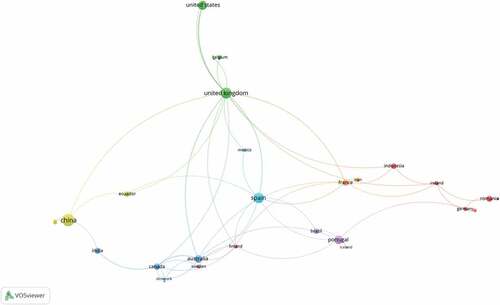
Table 4. General publication profiling of the research field of EC
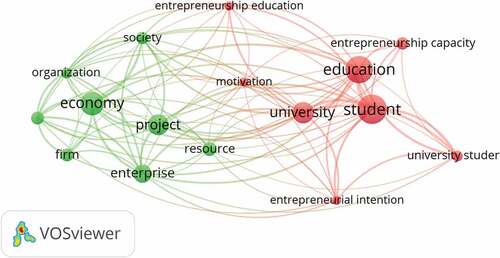
Figure 4. Network visualisation map of the author keywords.
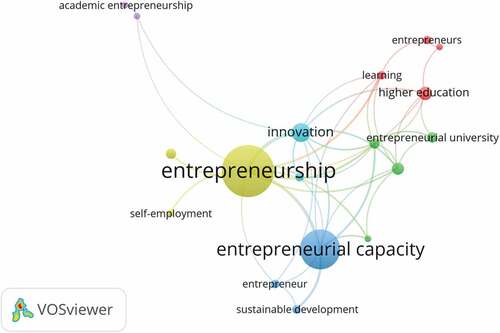
Table 5. Top keywords
Table 6. List of the author(s) for every document
Figure 5. Network visualisation map of the co-authorship.
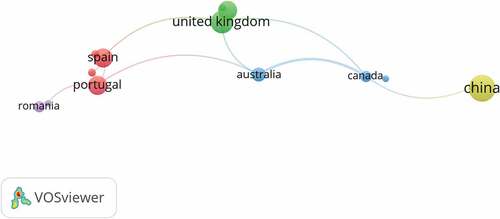
Figure 6. Network visualisation map of the co-authorship.
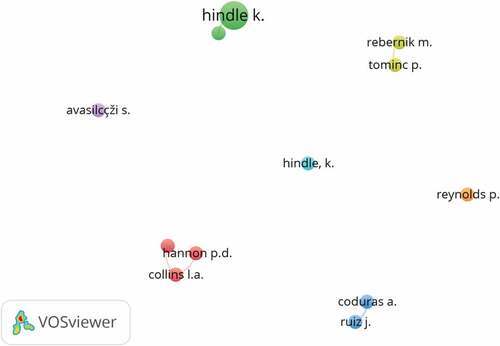
Table 7. Citations metrics
Figure 7. Most influential authors.
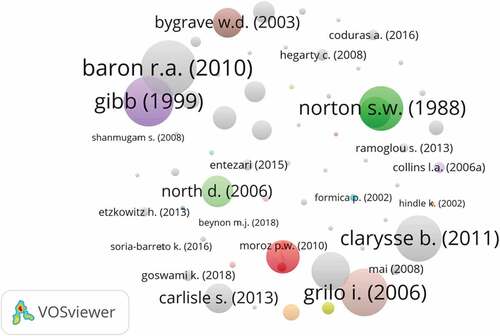
Table 8. Highly cited articles: most influential authors
Figure 8. VOSvViewer Visualization of a Term Co-occurrence Network Based on TitleFields (Full Counting).
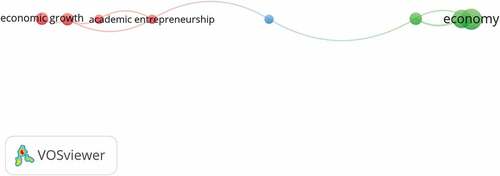
Figure 9. VOS Viewer Visualization of a Term Co-occurrence Network Based on Title and Abstract Fields (Binary Counting).