
Figures & data
Table 1. Reliability values from cronbach’s alpha coefficients
Table 2. Profile of respondents
Table 3. Construct reliability, indicator reliability, and convergent validity
Table 4. Heterotrait-monotrait ratio (HTMT)
Table 5. PLS predict for the constructs
Table 6. Model fit summary
Table 7. Summary of structural model
Figure 1. Structural path coefficients and bootstrapping.
Note: EPS, IAE, RMP, SA, and SS represent Enactments, policies, standards, systems and procedures, Internal audit effectiveness, Risk management process, Sustainability audits and Sustainability sensitivity.
Figure 2. Importance-performance map.
Note: EPS, IAE, RMP, SA, and SS represent Enactments, policies, standards, systems and procedures, Internal audit effectiveness, Risk management process, Sustainability audits and Sustainability sensitivity.
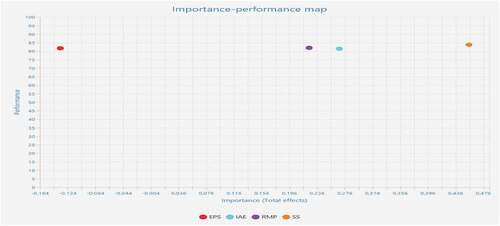
Table 8. Importance-performance values
Data availability statement
Data is available upon request