
Figures & data
Table 1. Summarising the R-squared or Adjusted R-square of price model
Table 2. Industry classification
Table 3. Sample selection
Table 4. Industry reclassification
Table 5. Descriptive statistics
Table 6. Pearson correlation (* significance at 0.1 level , ** significance at 0.05 levels, *** significance at 0.01 significance levels
Table 7. Result of regression test
Table 8. Result of regression test with positive earning firms and negative earning firms
Table 9. Pooled and yearly cross-sectional regressions on earnings and book value (standard errors in parentheses *** p < 0.01, ** p < 0.05, * p < 0.1)
Figure 1. The fluctuation of explanatory power adjusted R2.
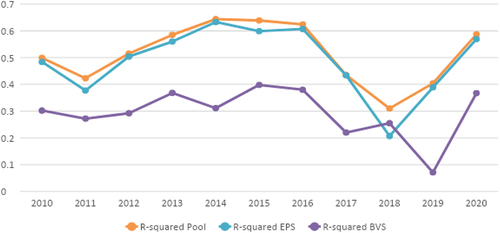
Table 10. Association between R2 and time trend 2010–2020
Table 11. Association between residual dispersion and time trend 2010–2020
Table 12. Impact of accounting reform on value relevance
Table 13. Difference of value relevance between small and large companies