Figures & data
Table 1. Comparison between BCG matrix and sales matrix
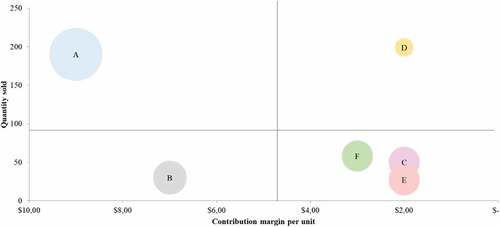
Figure 1. CMQ matrix.
Table 2. Initial position of the portfolio
Figure 2. CMQ matrix, initial situation (end month 1).
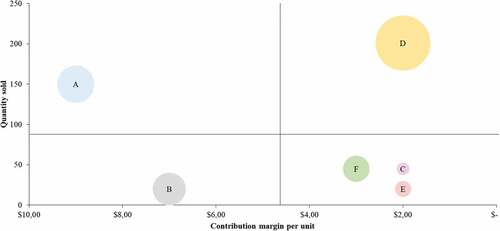
Table 3. Portfolio situation after actions
Figure 3. Adjustment to the planning of product quantities.
Figure 4. Significance of the achieved variations.
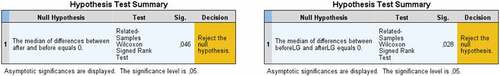
Figure 5. CMQ matrix, actual situation (end month 2).