
Figures & data
Table 1. Distribution of the sample per activity branch
Figure 1. Average management score per city and sector.
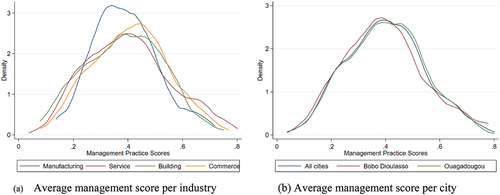
Table 2. Descriptive statistics
Figure 2. Distribution of management practice score.
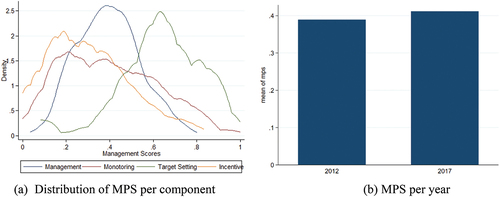
Figure 3. Management score and Performances.
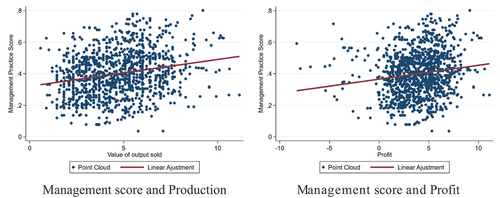
Table 3. Management practices and firms’ performance
Table 4. Management and targeting scores
Table 5. Monitoring scores and management
Table 6. Incentives and performance
Table 7. Management practices and performance of smaller firms
Table 8. Management practices and performance of smaller firms
Table A1. Test of selection bias
Table A2. Descriptive statistics of all the variables used
Table A3. T-Test on the characteristics of SMEs in 2017 and 2012