
Figures & data
Table 1. Trade data for Colombian paper sector (2020)
Table 2. Review of previous IMS studies using MCDM methods
Figure 1. Methodological process proposed for the study.
Source: Own elaboration.
Figure 2. Scheme of evaluation criteria of the study.
Source: Own elaboration adapted from Vanegas-López et al. (Citation2021).Notes: * The market reference price corresponds to the average export price per KG of the main products produced in Colombia in the international markets.** The cultural distance corresponds to the cultural difference between Colombia and the 18 buyer countries.
Table 3. Alternative paper and paperboard purchasing markets
Table 4. Sample of paper and board firms under study
Figure 3. AHP hierarchical structure of the factors.
Source: Own elaboration based on Vanegas-López et al. (Citation2021).
Table 5. General and specific weights of the IMS criteria
Figure 4. Positive distances from the average (PDA) of international markets.
Source: Own elaboration.
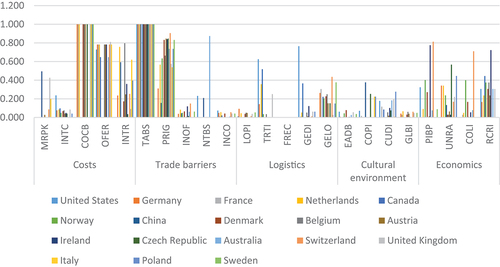
Figure 5. Negative distances from the average of the international markets evaluated.
Source: Own elaboration.
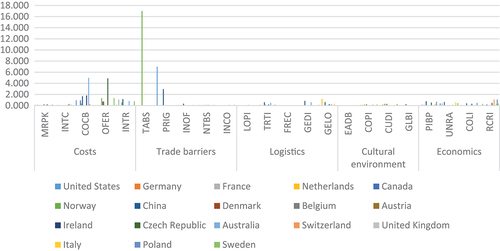
Figure 6. Map of optimal international markets for paper exports.
Source: Own elaboration.
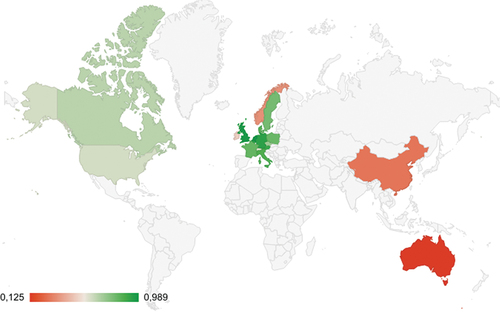
Table 6. Ranking of paper and paperboard market viability