Figures & data
Figure 1. Conceptual model of the study.
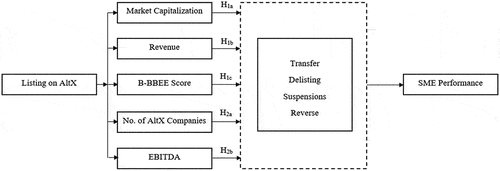
Table 1. Descriptive statistics and correlations
Table 2. Hypothesis OLS analysis output tabulation
Table 3. Granger causality tests for the group output tabulation
Figure 2. Influence statistics of hypothesis 1.
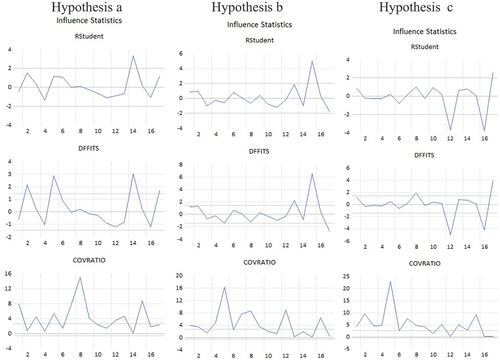
Figure 3. Influence statistics of hypothesis 2.
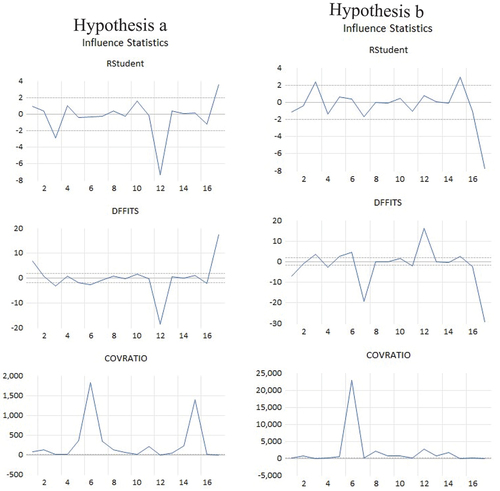
Figure A1. Leverage plots of AltX_MarketCap vs. hypothesis 1a variable.
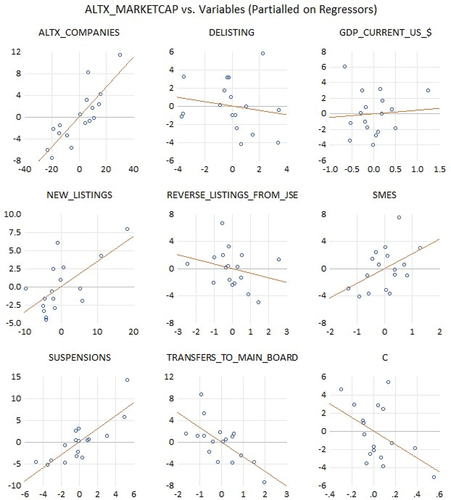
Figure A2. Leverage plots of revenue vs. hypothesis 1b variable.
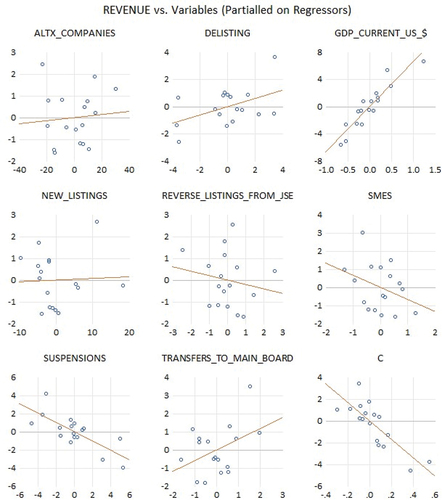
Figure A3. Leverage plots of B_BBEE_Score vs. hypothesis 1c variables.
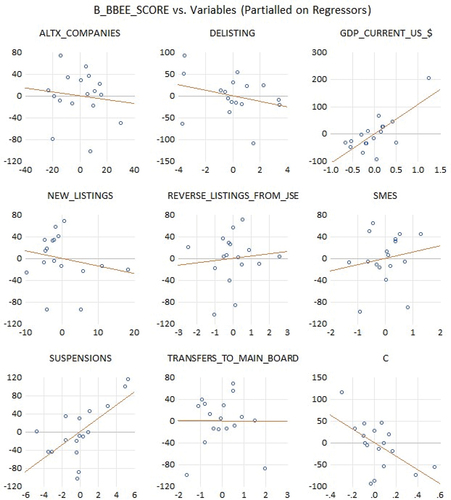
Figure A4. Leverage plots of AltX_Companies vs. hypothesis 2a variables.
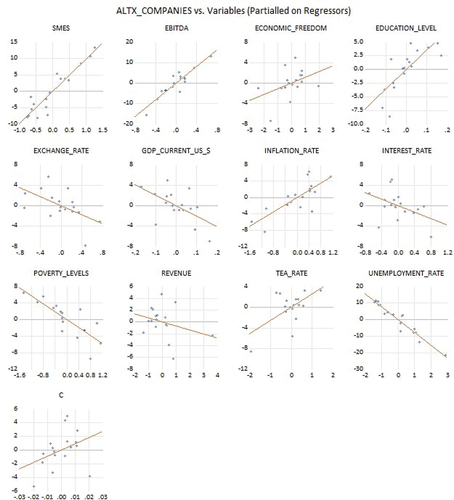
Figure A5. Leverage plots of EBITDA vs. hypothesis 2b variables.
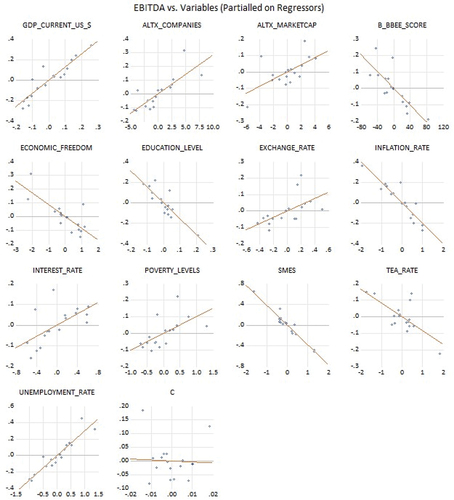
Figure A6. Multiple series stacked graph for hypothesis 1a.
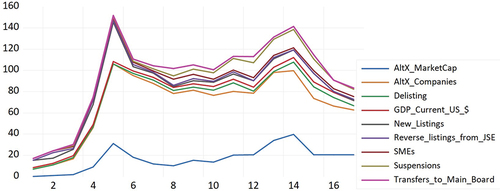
Figure A7. Forecast for hypothesis 1a.
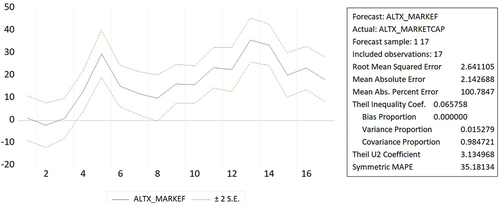
Figure A8. Multiple series stacked graph for hypothesis 1b.
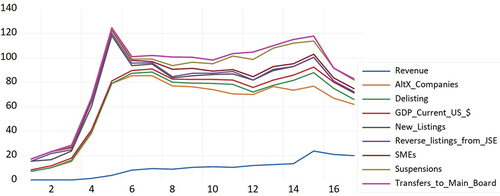
Figure A9. Forecast for hypothesis 1b.
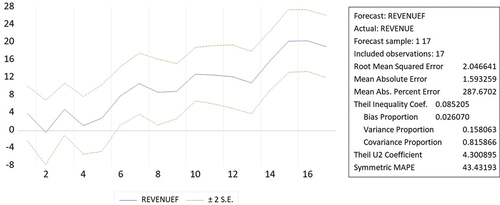
Figure A10. Multiple series stacked graph for hypothesis 1c.
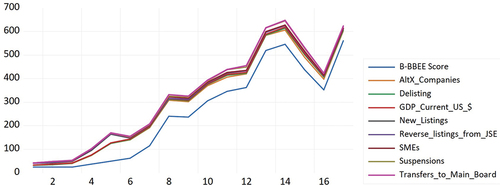
Figure A11. Forecast for hypothesis 1c.
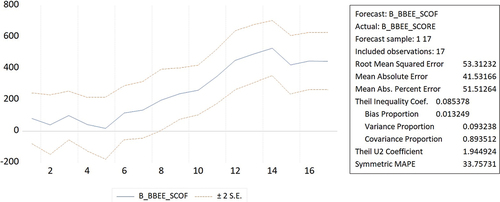
Figure A12. Multiple series stacked graph for hypothesis 2a.
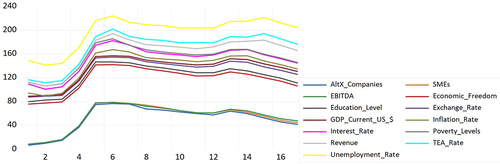
Figure A13. Forecast for hypothesis 2a.
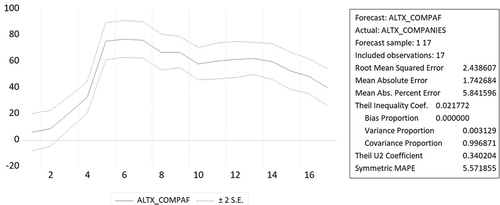
Figure A14. Multiple series stacked graph for hypothesis 2b.
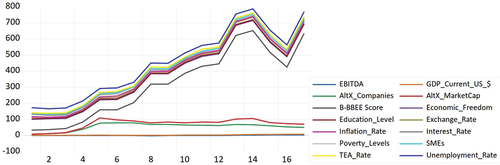
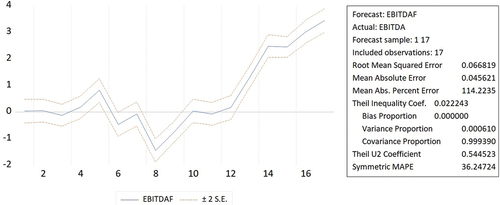
Figure A15. Forecast for hypothesis 2b.