
Figures & data
Figure 1. The theoretical framework of the study.
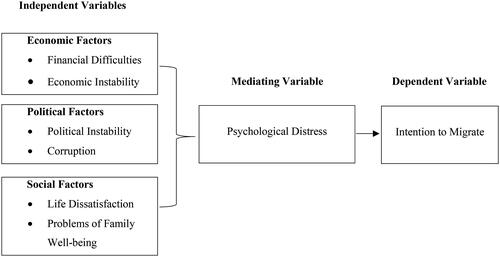
Table 1. Demographic profile of the respondents.
Table 2. Descriptive statistics.
Table 3. Internal consistency reliability.
Figure 2. The measurement model.
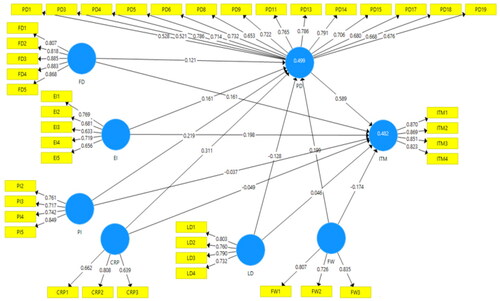
Table 4. Discriminant validity.
Figure 3. The structural model.
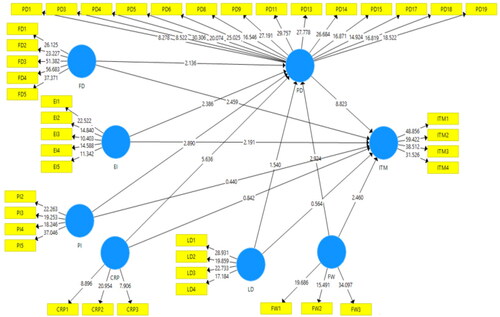
Table 5. Direct relationship.
Table 6. Indirect relationship.
Table 7. Hypothesis testing summary.
Table A1. Items and description.