
Figures & data
Figure 1. Conceptual framework of the study.
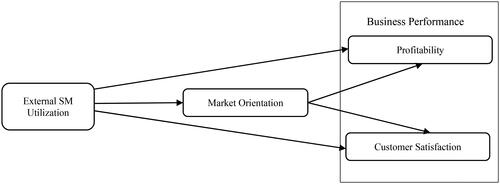
Table 1. Reliability analysis of pilot study (N = 42).
Table 2. Result of normality and multicollinearity.
Table 3. Profile of the respondents.
Table 4. Profile of SMEs.
Table 5. Level of the variables.
Table 6. Factor loading, reliability and validity.
Table 7. Heterotrait-Monotrait Ratio (HTMT).
Figure 2. Structural model.
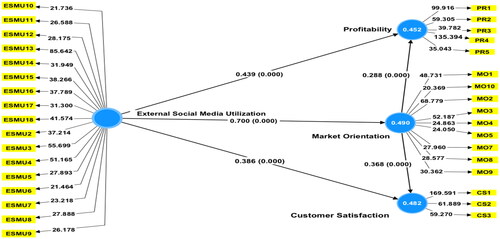
Figure 3. Structural model of second order.
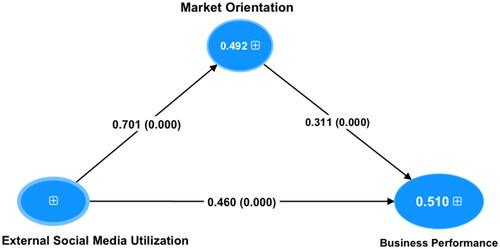
Table 8. Result of hypotheses testing.