
Figures & data
Table 1. Characteristics and challenges of CBE as identified by Peredo and Chrisman in 2006.
Table 2. Inclusion-exclusion criteria.
Figure 1. Steps explaining the process of material and methods and analysis.
Source: Prepared by authors.
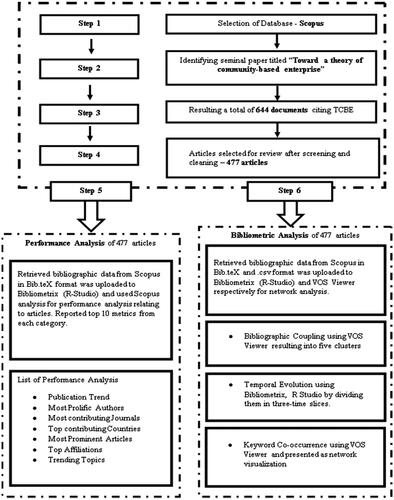
Figure 2. Publication trend of articles. Note: The figure also shows the number of citations received by the articles published each year from 2005 to 2021. N = 477.
Source: Prepared by authors.
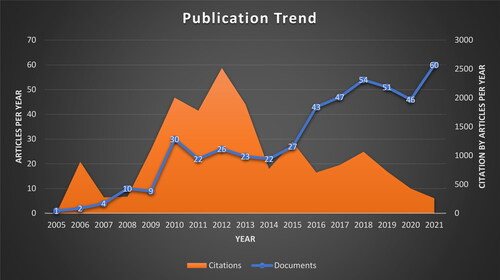
Table 3. Top contributing affiliations.
Table 4. Most contributing journals.
Table 5. Most prolific authors.
Table 6. Most prominent articles.
Table 7. Top contributing countries.
Figure 3. Trending words.
Source: Created using Bibliometrix (R Studio).
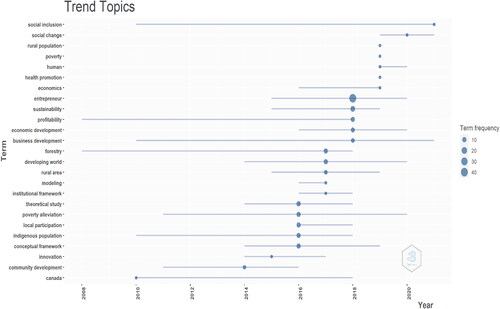
Table 8. Cluster table.
Figure 4. Three-field plot showing the temporal evolution of keywords. The complete duration is divided into three-time slices.
Source: Prepared by authors using Bibliometrix (R Studio).

Figure 5. Temporal evolution—time slice 1.
Source: Created using Bibliometrix (R Studio).
Figure 6. Temporal evolution—time slice 2.
Source: Created using Bibliometrix (R Studio).
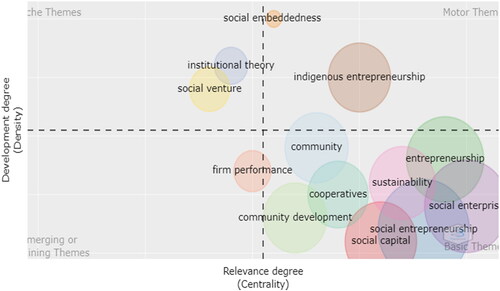
Figure 7. Temporal evolution—time slice 3.
Source: Created using Bibliometrix (R Studio).
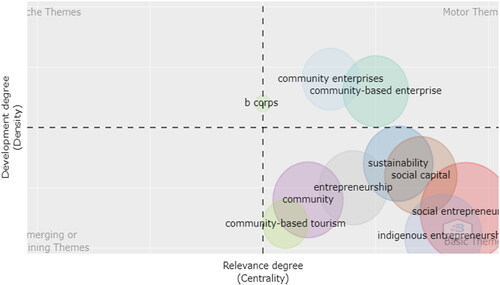
Figure 8. Co-occurrence analysis of author keywords.
Source: Created using VOS Viewer.
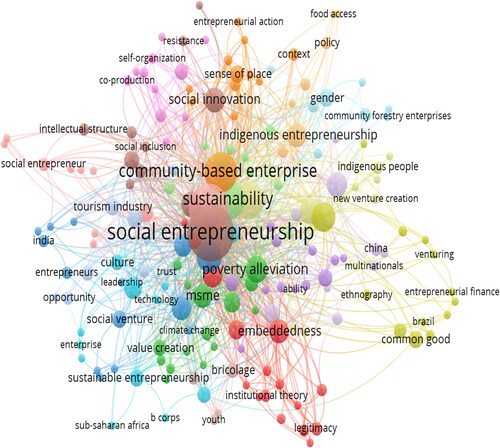
Table 9. Keyword co-occurrence.
