
Figures & data
Figure 1. Conceptual framework of the study. (Source: Author's own work).
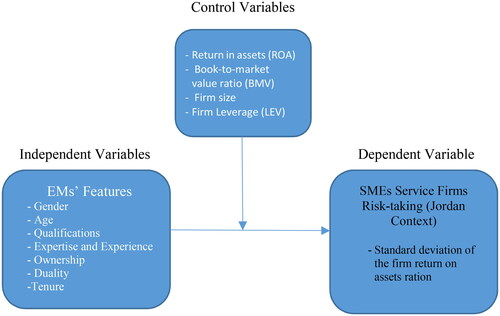
Table 1. Illustrates the survey's information that includes all variables/dimensions, reliability values, #. of questions, sources, and abbreviations. (Source: Authors' own work).
Table 2. Illustrates the method used to select the targeted sample and the type of small and medium-sized service industries. (Source: Authors' own work).
Table 3. Descriptive statistics of quantitative variables. (Source: Authors' own work).
Table 4. Pearson correlation matrix. (Source: Authors' own work).
Table 5. Results of the ordinary least square regression. (Source: Authors' own work).
Table 6. The regression analysis on the dependent variablesTable Footnote*. (Source: Authors' own work).
Data availability statement
All data are available and upon request from the authors.
