
Figures & data
Figure 1. Research framework.
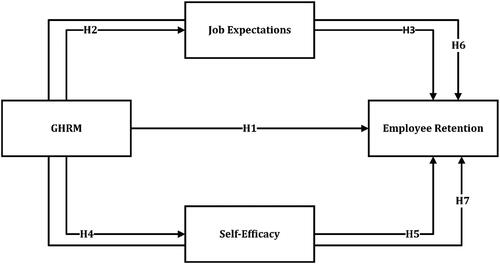
Table 1. Profile respondents.
Table 2. Common method bias test.
Table 3. Measurement model.
Table 4. HTMT ratio for discriminant validity.
Table 5. PLS predict.
Table 6. Path coefficient, R-square, direct, and indirect effects.
Data availability statement
The raw data supporting the conclusions of this article will be made by request to the corresponding authors.
