
Figures & data
Figure 1. The conceptual framework.
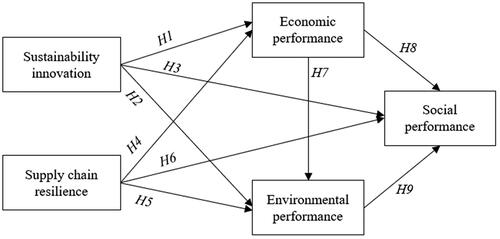
Figure 2. Research process.
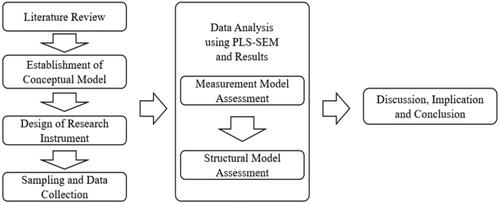
Table 1. Measurement items.
Table 2. Demographic profile.
Table 3. Total variance explained.
Table 4. Assessment of measurement model.
Table 5. Fornell-Larcker test.
Table 6. HTMT method.
Figure 3. Research framework with results.
Notes: SI, sustainability innovation; SCRE, supply chain resilience; ECP, economic performance; ENP, environmental performance; SOP, social performance.
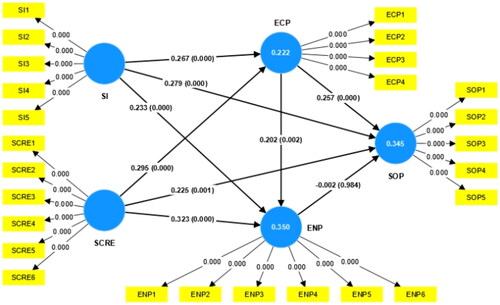
Table 7. Hypotheses testing.
Table 8. PLSpredict.
Data availability statement
The data that support the findings of this study are available from the corresponding author upon reasonable request.