
Figures & data
Figure 1. Conceptual framework explaining attitude, subjective norm, perceived behavioral control, eating intention, and individual characteristics.
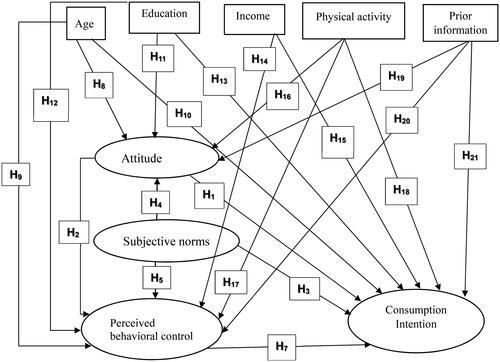
Table 1. Description of individual characteristics.
Table 2. Basic information presented to the participants about the benefits of Spirulina: adapted from Lucas et al. (Citation2023) with little modification.
Table 3. Description of TPB constructs and items.
Table 4. Percentage distribution of respondents’ characteristics.
Table 5. Mean and standard deviation of the behavioral factor constructs and items.
Table 6. Standardized loadings, reliability, and validity of the CFA model.
Table 7. Pearson’s correlation coefficient and discriminant validity.
Table 8. Overall goodness of fit of the measurement model.
Table 9. Structural relationship between the TPB constructs and hypotheses status.
Table 10. Structural relationship between individual characteristics and constructs of the TPB.
Table 11. Mediation effects.
Data availability statement
The data will be made available upon request from the corresponding author.