
Figures & data
Figure 1. Estimated research model. Source: Based on authors.
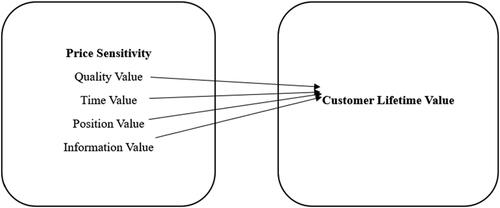
Figure 2. Structural equation model for phenomenon.
Note: The preceding . Displays the phenomenon’s structural equation model. It illustrates all the variables’ relationships. It also displays the final assertions that were used in the analysis.
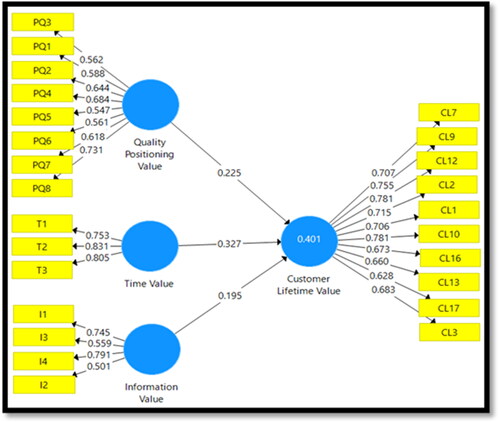
Table 1. Variables scale items and measures.
Table 2. Frequency tables for demographic variables.
Table 3. Model measurements of the phenomenon.
Table 4. Fornell-Larcker criterion for measuring discriminant validity of the theoretical model.
Table 5. Spearman correlation coefficients in phenomenon.
Table 6. Path coefficients of the model.
Table 7. Model evaluation metrics.
Data availability
The data that support the findings of this study are available from the corresponding author, Sarah Ahmed Awaad, upon reasonable request.