
Figures & data
Figure 1. Conceptual framework of the study.
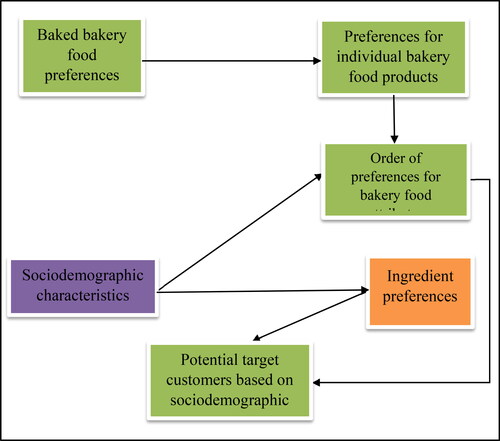
Table 1. Descriptive statistics for the socioeconomic characteristics of respondents.
Table 2. Consumption frequency of major baked food products: (1 = every day; 2 = ≥ three times a week; 3 = ≥ once a week; 4 = none).
Table 3. Consumption of baked goods at various mealtimes and occasions (1 = Often; 2 = Sometimes; 3 = None).
Table 4. Preferences of urban dwellers for bakery foods.
Table 5. Association between respondents’ characteristics and weekly consumption of bakery foods: Categories (1 = Everyday, 2 = ≥Three Times a Week, 3 = ≥Once a Week, 4 = None).
Table 6. Order of consumer preferences for attributes in bakery food purchases.
Figure 2. Consumer segments based on their preference on price and nutritional value of baked bakery foods.
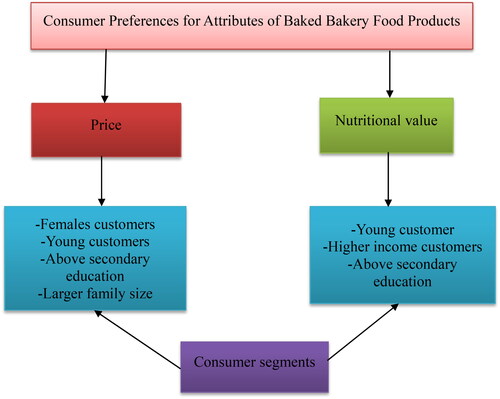
Table 7. Consumer preference for additional ingredients in baked goods (1 = No; 2 = Yes; 3 = Yes, Very Much; 4 = NA).
Figure 3. Consumer segments based on their preference for additional nutritious ingredients in baked bakery goods.
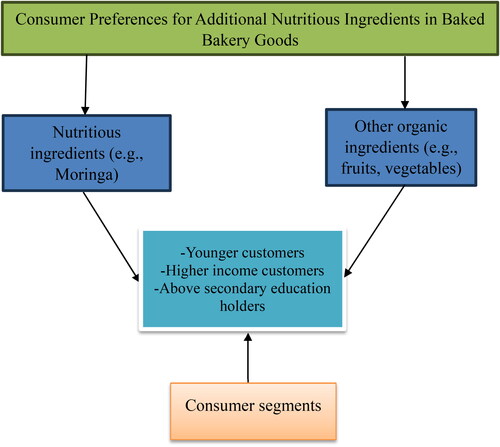
Table 8. Consumer perception of the health impact of nutrients (1 = Bad for Health; 2 = No Impact on Health; 3 = Good for Health; 4 = Not Aware; 5 = NA).
Data availability statement
The data will be made available upon request from the corresponding author.