
Figures & data
Table 1. Table of definitions.
Figure 1. Conceptual model of the study.
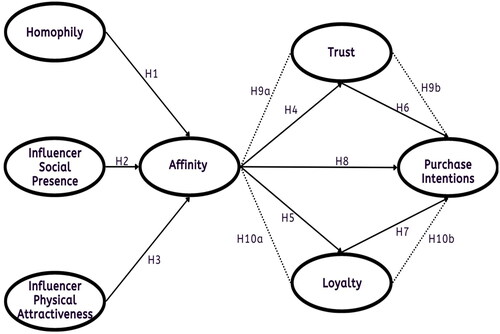
Table 2. Respondents demographics.
Table 3. Source and description of the study constructs.
Table 4. Composite reliability, factor loadings, Cronbach’s Alpha and AVE.
Table 5. Assessment of discriminant validity.
Table 6. Assessment of the model fit.
Figure 2. Empirically tested conceptual model (SmartPLS 4.0).
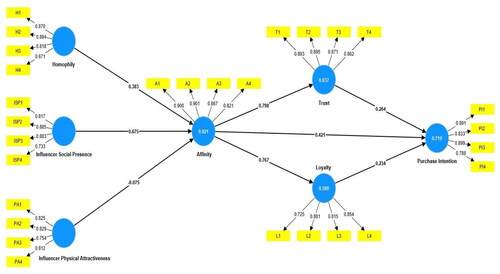
Table 7. Path coefficient.
Table 8. Predictive relevance analysis.
Table 9. Hypothesis Testing.
Table 10. Exploring mediation effects.
Table A1. Constructs with items and sources.
Supplemental material
Figure_Captions.docx
Download MS Word (12.7 KB)Figure_2.docx
Download MS Word (99.5 KB)Table_10.docx
Download MS Word (15.3 KB)Table_1.docx
Download MS Word (14.2 KB)Table_3.docx
Download MS Word (28.3 KB)Table_4.docx
Download MS Word (17 KB)Table_6.docx
Download MS Word (13.9 KB)Table_7.docx
Download MS Word (14.7 KB)Table_2.docx
Download MS Word (15.2 KB)Annexure_I_Table_11.docx
Download MS Word (16.1 KB)Table_8.docx
Download MS Word (13.6 KB)Table_9.docx
Download MS Word (16 KB)Table_5.docx
Download MS Word (15 KB)Data availability statement
The data supporting the findings in this manuscript are available upon request. To access the data, please contact the corresponding author at [email protected]