
Figures & data
Table 1. Questionnaire distribution and retrieval
Table 2. Demographic characteristics of respondents
Table 3. Mean and standard deviation of variables based on the business sector
Figure 1. Inner model (path co-efficient); outer model (outer weights/loadings).
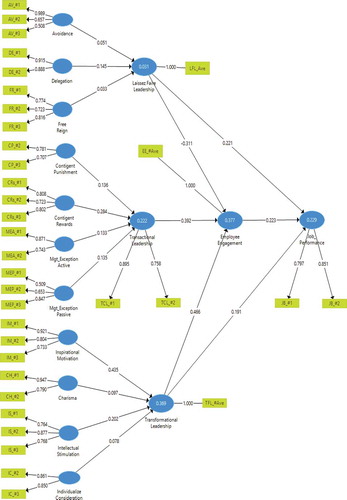
Figure 2. Inner model (path co-efficient and p-values); outer model (outer weights/loadings and P-values).
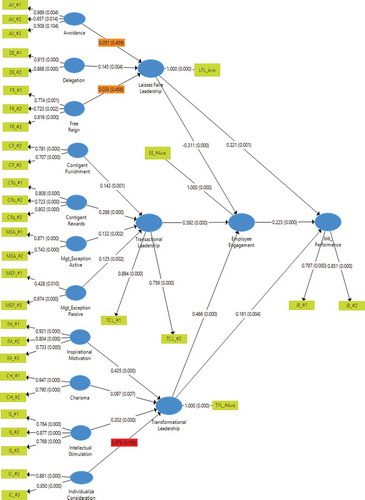
Figure 3. Inner model (path co-efficient and P-values); outer model (outer weights/loadings and T-values).
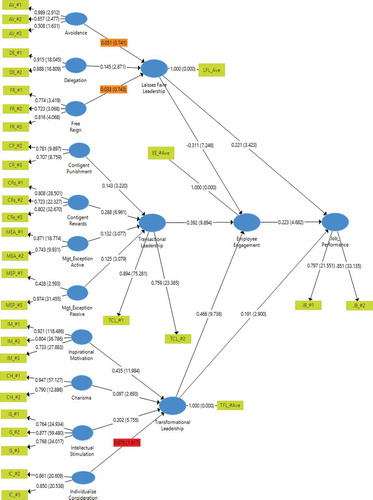
Table 4. Correlation co-efficient table