
Figures & data
Table 1. Frequency of respondents’ usage of mainstream and digital media
Table 2. Information preference of respondents on mainstream and digital media
Figure 1. Showing respondents’ rating of mainstream media and digital media credibility
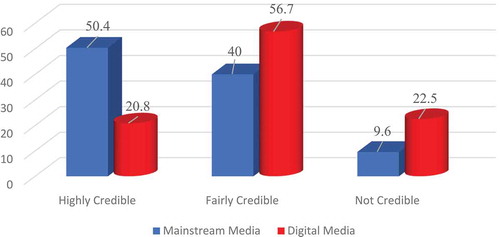
Figure 2. Graphical representation of the relationship between media exposure, information preference and perceived media credibility
Note: Numbers show statistical relationship where p <.05
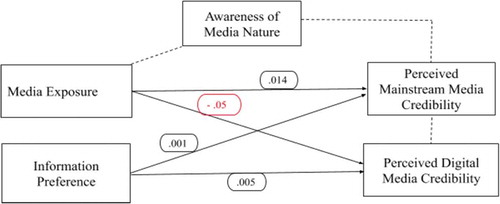
Table 3. Means of credibility factors and credibility index overall (n = 240)