
Figures & data
Figure 1. 30 years health institution development in Gojjam (1958–1988).
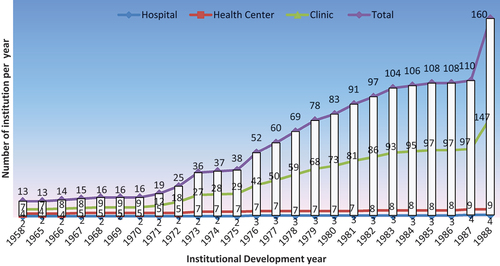
Figure 2. Health institution development rate in percent (1974–1979).
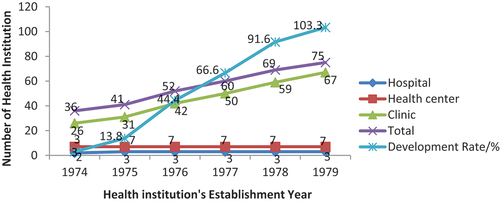
Figure 3. Health personnel per health institution (1978).
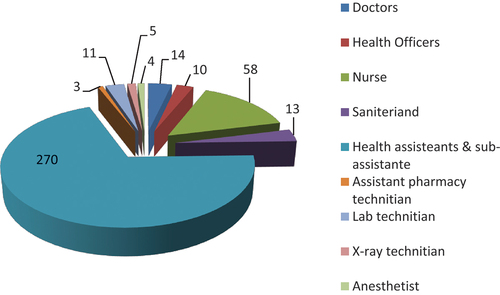
Table 1. Distance of health institution from province’s health prevention head office
Table 2. Customary–midwifes and qebelle health Delegates training Plan and Performance (in 1988)
Table 3. Child delivery service provided by Customary–midwifes (in 1988)
Table 4. Distribution of health professionals per health institution (in 1988)
Table 5. In-service trainees in Gojjam province (in 1988)
Table 6. Tope diseases identified in Gojjam province in 1988
Figure 4. Top ten diseases which affected people of Gjjam province in 1998.
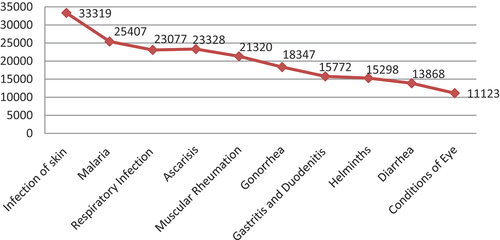
Table 7. Institutional service to population ratio/1990
Table 8. Institutional service to population ratio/1994
Table 9. Health personnel per institution in East Gojjam administrative zone
Table 10. National, regional and zonal level health personnel service to people ratio/1990s
Figure 5. Health institution development/1995 – 1999/.
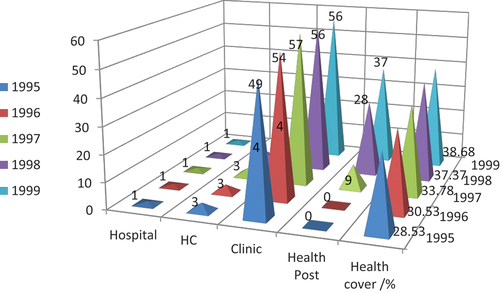
Figure 6. Institutional per population Service/1995–1999/.
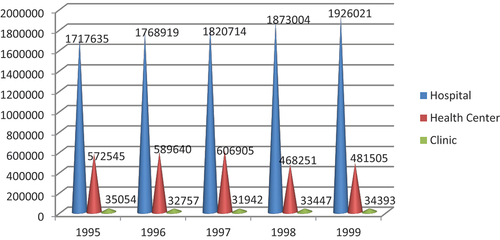
Figure 7. Health professionals in East Gojjam administrative zone/1995 – 1999.
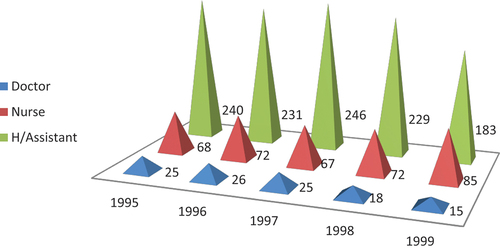
Figure 8. Health professional’s service to population ratio in comparison with the international standard/1995 – 1999/.
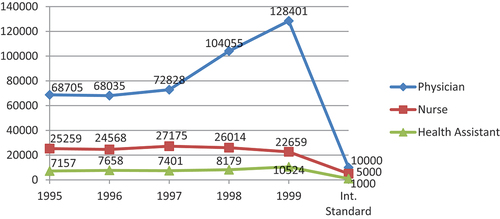
Figure 9. Budget allocation for health institutions/1965 – 1988.
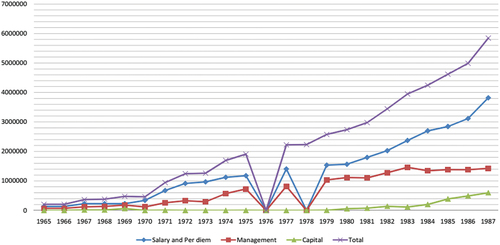
Table 11. Budget allocation development trend for health institutions
Table 12. Health professional and administrative stuff development trend/1965 – 1988