Figures & data
Figure 1. Conceptual diagram of the developing. Source: Author.
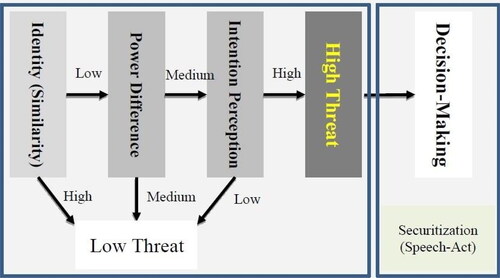
Figure 2. A research framework. Source: Author.
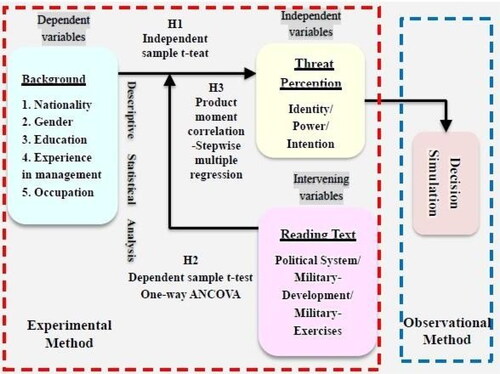
Table 1. Pre-test summary of threat-perception.
Table 2. Post-test summary of threat-perception.
Table 3. Cronbach’s α coefficients of the pre-test for threat-perception.
Table 4. Quasi-experimental design table.
Table 5. Basic data of research subjects (n = 66).
Table 6. Independent variable t-tests for each dimension of developing threats: Taiwanese versus foreigners (n = 66).
Table 7. Independent variables t-tests for each dimension of developing threat – Military Personnel versus others (n = 66).
Table 8. Paired samples t-test after accepting experimental inputs (n = 66).
Table 9. Paired samples t-test after accepting experimental inputs – three dimension (n = 66).
Table 10. Descriptive statistics analysis–pre-test and post-test of the questionnaires for each dimension versus developing threats (n = 66).
Table 11. Levene test: the questionnaires for each dimension versus developing threat (n = 66).
Table 12. Intra-group homogeneity test: the questionnaires for each dimension versus developing threat (n = 66).
Table 13. ANCOVA: the questionnaires of controlled groups for each dimension versus developing threat (n = 66).
Table 14. The original and adjusted mean: the questionnaires for each dimension versus developing threat (n = 66).
Table 15. Product moment correlation between identity level, power perception, intention perception and threat perception (n = 66).
Table 16. Product moment correlation-power-perception versus intention-perception (n = 66).
Table 17. Actions taken by all groups in Scenario 1.
Table 18. Actions taken by all groups in Scenario 2.
Table 19. Actions taken by all groups in Scenario 3.
Table 20. Actions taken by all groups in Scenario 4.
Table 21. Actions taken by all groups in Scenario 5.
Table 22. Actions taken by all groups in Scenario 6.
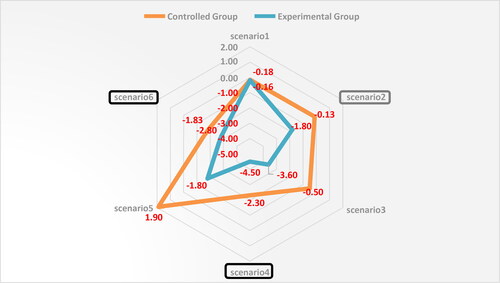
Table 23. WEIS values in different scenarios.
Table 24. Research hypotheses results and analysis.
Figure 3. Average WEIS values in different Scenarios. Source: Author.