
Figures & data
Figure 1. Probability histogram of the best fit distribution related to the ‘Second Livre, Pièces de viole des Cinq Livres’. Figure based on the work of Lugo and Alatriste-Contreras (Citation2024a). Based on the reported results of this reference, we used the estimated parameters related to the ‘Second Livre’ for reproducing this Figure. The size of the sample was equal to 10, 000. In addition, using the Anderson-Darling test for testing the presence of an exponential case, we find an statistic of 0.39409108950530936. Because this value is smaller than the significance level of 1%, the null hypothesis cannot be rejected, then the data come from the exponential distribution.
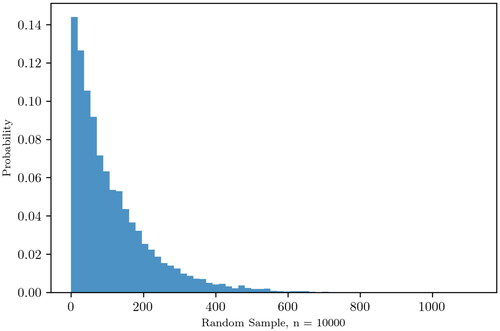
Figure 2. Flowchart of the musical composition.
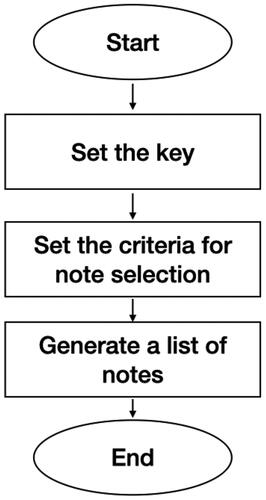
Table 1. Distributions and criteria for note selection.
Figure 3. Probability histogram of entropy values. Each random realization is a list of 10, 000 entropy values in the key of E minor. Each value was the output of executing the stochastic process based on the type of statistical distribution and the criteria of note selection. The label of each subfigure is related to the type of statistical distribution used in each random realization (). See for the descriptive statistics of each random realization.
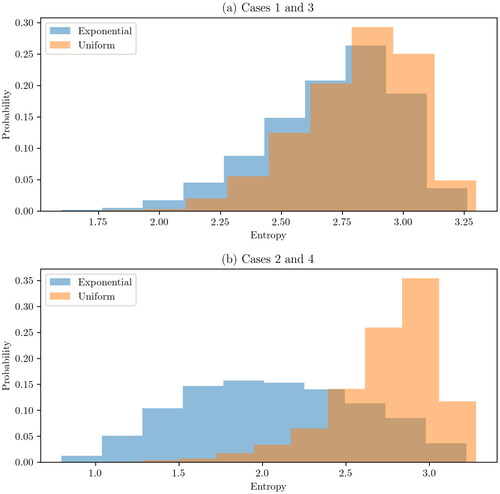
Table 2. Descriptive statistics for case, entropy values.
Table 3. Spearman correlation coefficient between random realizations.
Data availability statement
The data and the code that support the findings of this study are openly available in [‘Music composition and statistical analysis’] at https://osf.io/nqg7u/?view only = 6d546bec469049b68fe08704ec97b6ad.