1,042
Views
9
CrossRef citations to date
0
Altmetric
Research Article

Electrooxidation of antihistamine drug methdilazine and its analysis in human urine and blood samples

, & | (Reviewing Editor)
Article: 1153274 | Received 05 Dec 2015, Accepted 07 Feb 2016, Published online: 02 Mar 2016

Figures & data

Figure 1. Cyclic voltammograms of 1.0 mM K3[Fe(CN)6] in 1.0 M KCl at different scan rates: (a) 0.003; (b) 0.005; (c) 0.007; (d) 0.01; (e) 0.03; (f) 0.05; (g) 0.09; (h) 0.1 V s−1. Inner figure represents the dependence of peak current Ip/μA on the square root of scan rate υ1/2/V s−1.

Figure 1. Cyclic voltammograms of 1.0 mM K3[Fe(CN)6] in 1.0 M KCl at different scan rates: (a) 0.003; (b) 0.005; (c) 0.007; (d) 0.01; (e) 0.03; (f) 0.05; (g) 0.09; (h) 0.1 V s−1. Inner figure represents the dependence of peak current Ip/μA on the square root of scan rate υ1/2/V s−1.

Figure 2. Cyclic voltammograms of 1.0 m M MDH on GCE in pH 9.2, phosphate buffer (I = 0.2 M) (a) blank and (b) MDH run at 0.1 V s−1.
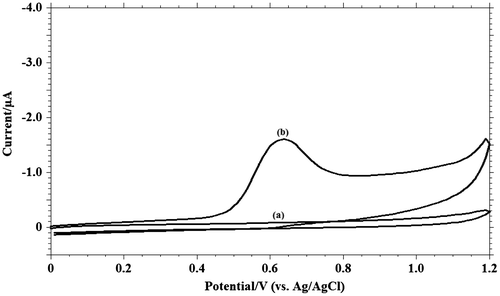
Figure 2. Cyclic voltammograms of 1.0 m M MDH on GCE in pH 9.2, phosphate buffer (I = 0.2 M) (a) blank and (b) MDH run at 0.1 V s−1.

Figure 3. Surfactant behaviour on MDH: Cyclic voltammograms of MDH (a) with cetyltrimethylammonium bromide (anionic surfactant); (b) with sodium dodecyl sulfate (cationic surfactant); (c) with Triton-X (non-ionic surfactant); (d) without surfactant.
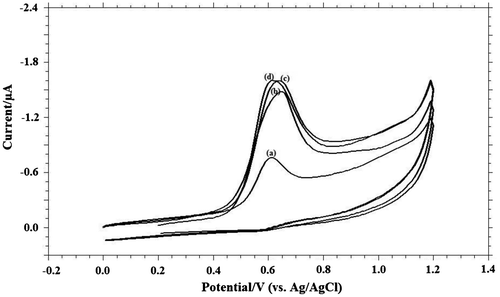
Figure 3. Surfactant behaviour on MDH: Cyclic voltammograms of MDH (a) with cetyltrimethylammonium bromide (anionic surfactant); (b) with sodium dodecyl sulfate (cationic surfactant); (c) with Triton-X (non-ionic surfactant); (d) without surfactant.

Figure 4. (A) Cyclic voltammograms obtained for 1.0 mM MDH in buffer solution at (a) blank; (b) pH 6.0; (c) pH 8.0; (d) pH 9.2; (e) pH 10.4; (f) pH 11.2; (B) Variation of peak currents Ip / μA of MDH with pH; (C) Influence of pH on the peak potential Ep/V of MDH.
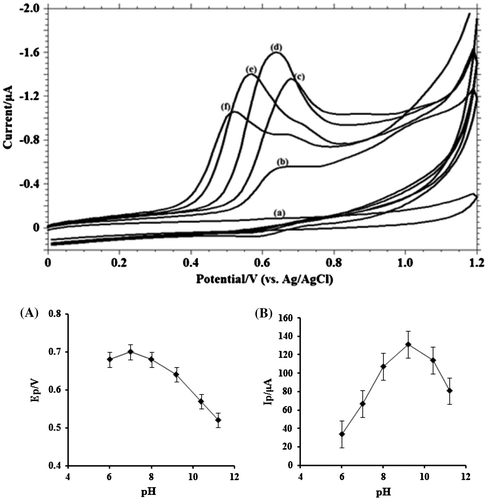
Figure 4. (A) Cyclic voltammograms obtained for 1.0 mM MDH in buffer solution at (a) blank; (b) pH 6.0; (c) pH 8.0; (d) pH 9.2; (e) pH 10.4; (f) pH 11.2; (B) Variation of peak currents Ip / μA of MDH with pH; (C) Influence of pH on the peak potential Ep/V of MDH.

Figure 5. Cyclic voltammograms of 1.0 mM MDH in buffer solution of pH 9.2 (I = 0.2 M) at scan rate of: (1) blank; (2) 0.001; (3) 0.005; (4) 0.01; (5) 0.02; (6) 0.03; (7) 0.05; (8) 0.06; (9) 0.08; (10) 0.1; (11) 0.13; (12) 0.17; (13) 0.20; (14) 0.30 V s−1. (A) Dependence of peak current (Ip/μA) on the scan rate (υ/V s−1); (B) Plot of logarithm of peak current (log Ip/μA) vs. logarithm of scan rate (log υ/V s−1); (C) Plot of variation of peak potential (Ep/V) with logarithm of scan rate (log υ/V s−1).
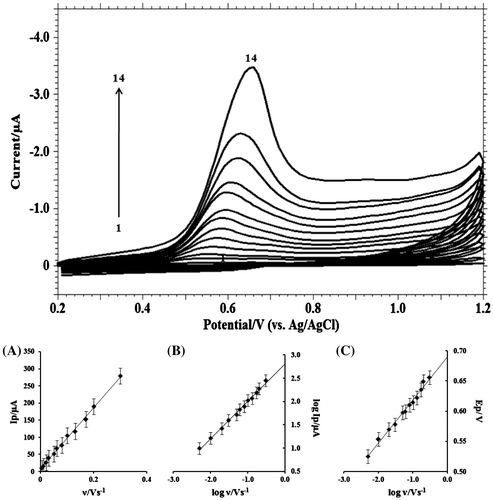
Figure 5. Cyclic voltammograms of 1.0 mM MDH in buffer solution of pH 9.2 (I = 0.2 M) at scan rate of: (1) blank; (2) 0.001; (3) 0.005; (4) 0.01; (5) 0.02; (6) 0.03; (7) 0.05; (8) 0.06; (9) 0.08; (10) 0.1; (11) 0.13; (12) 0.17; (13) 0.20; (14) 0.30 V s−1. (A) Dependence of peak current (Ip/μA) on the scan rate (υ/V s−1); (B) Plot of logarithm of peak current (log Ip/μA) vs. logarithm of scan rate (log υ/V s−1); (C) Plot of variation of peak potential (Ep/V) with logarithm of scan rate (log υ/V s−1).

Figure 6. Linear sweep voltammograms of 1.0 mM MDH in 0.2 M phosphate buffer solution of pH 9.2 at scan rate of: (1) blank; (2) 0.001; (3) 0.002; (4) 0.004; (5) 0.008; (6) 0.01; (7) 0.02; (8) 0.04; (9) 0.06; (10) 0.08; (11) 0.15; (12) 0.20; (13) 0.30 V s−1.
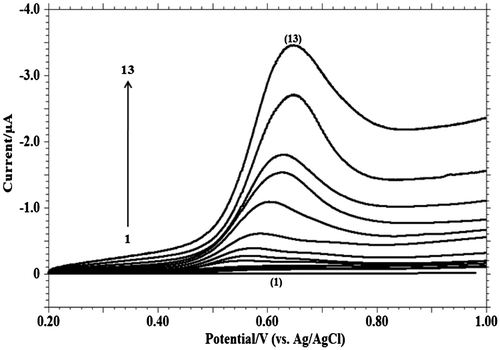
Figure 6. Linear sweep voltammograms of 1.0 mM MDH in 0.2 M phosphate buffer solution of pH 9.2 at scan rate of: (1) blank; (2) 0.001; (3) 0.002; (4) 0.004; (5) 0.008; (6) 0.01; (7) 0.02; (8) 0.04; (9) 0.06; (10) 0.08; (11) 0.15; (12) 0.20; (13) 0.30 V s−1.

Figure 7. Differential-pulse voltammograms with increasing concentrations of MDH in pH 9.2 phosphate buffer solution on GCE (a) blank; (b) 1 × 10−3; (c) 3 × 10−3; (d) 5 × 10−3; (e) 7 × 10−3; (f) 1 × 10−4; (g) 1 × 10−5; (h) 5 × 10−5; (i) 3 × 10−6. Inner figure represents the plot of peak current (Ip/μA) vs. concentration (C).
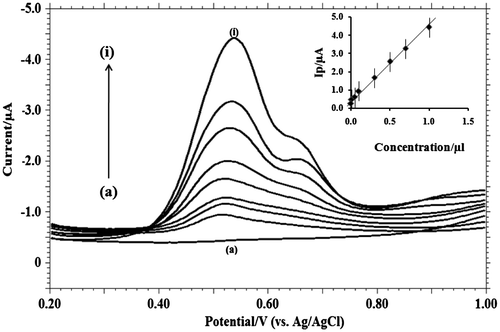
Figure 7. Differential-pulse voltammograms with increasing concentrations of MDH in pH 9.2 phosphate buffer solution on GCE (a) blank; (b) 1 × 10−3; (c) 3 × 10−3; (d) 5 × 10−3; (e) 7 × 10−3; (f) 1 × 10−4; (g) 1 × 10−5; (h) 5 × 10−5; (i) 3 × 10−6. Inner figure represents the plot of peak current (Ip/μA) vs. concentration (C).

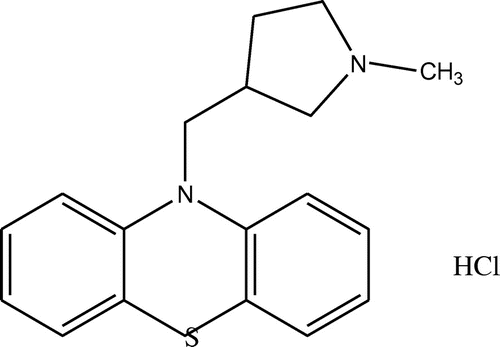
Scheme 1. Chemical structure of methdilazine hydrochloride.

Scheme 1. Chemical structure of methdilazine hydrochloride.

Scheme 2. Possible electrode reaction mechanism of methdilazine.

Scheme 2. Possible electrode reaction mechanism of methdilazine.

Table 1. Characteristics of methdilazine calibration plot using differential pulse voltammetry at GCE

Table 2. Analysis of MDH in dilosyn expectorant by DPV and its recovery studies

Table 3. Determination of MDH in human urine and blood samples by DPV at GCE

Table 4. Influence of potential interferents on the voltammetric response of 1.0 mM MDH at GCE by DPV