955
Views
11
CrossRef citations to date
0
Altmetric
Research Article

Molecular dynamics simulations in drug delivery research: Calcium chelation of G3.5 PAMAM dendrimers

, , & | (Reviewing Editor)
Article: 1229830 | Received 07 Jul 2016, Accepted 24 Aug 2016, Published online: 22 Sep 2016

Figures & data

Figure 1. Average of the radial distributions of the Ca2+ and Cl ions over the three runs performed for the EDTA and Ca2+ system in water.

Figure 1. Average of the radial distributions of the Ca2+ and Cl− ions over the three runs performed for the EDTA and Ca2+ system in water.
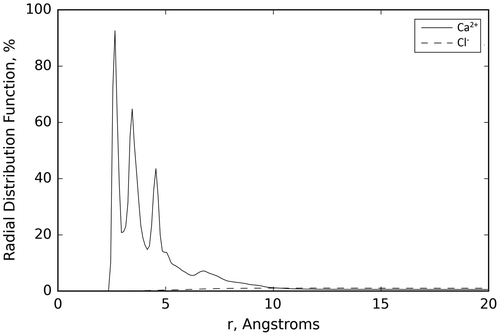
Table 1. Average distance and average minimum distance from the van der Waals surface of the EDTA molecule and average percentage dwell time of the counter ions (Cl and Ca2+) included in this simulation

Table 2. Average distance and average minimum distance from the van der Waals surface of the EDTA molecule and average percentage dwell time of the counter ions (Cl, Na+, and Ca2+) included in this simulation

Figure 2. Three-dimensional representation of the final recorded step of one of the MD simulations of the G3.5 PAMAM dendrimer and Ca2+ in water.
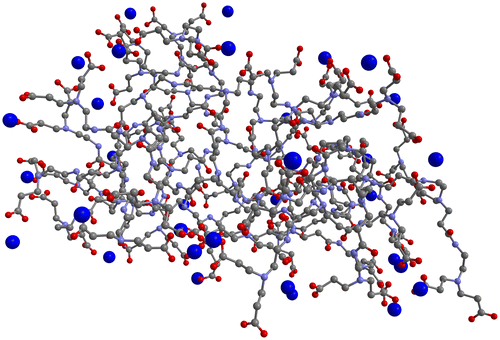
Note: The blue spheres represent Ca2+ ions present in close proximity to the G3.5 PAMAM dendrimer.
Figure 2. Three-dimensional representation of the final recorded step of one of the MD simulations of the G3.5 PAMAM dendrimer and Ca2+ in water.
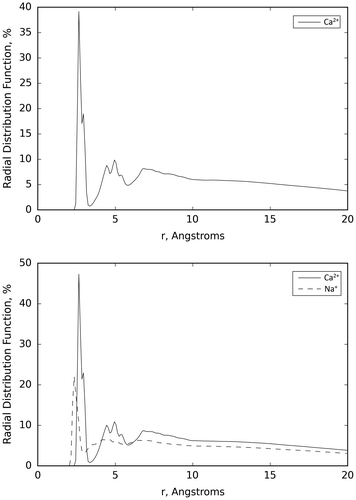
Table 3. Average distance and average minimum distance from the van der Waals surface of the G3.5 PAMAM molecule and average percentage dwell time of the counter ions (Ca2+) included in this simulation

Table 4. Average distance and average minimum distance from the van der Waals surface of the G3.5 PAMAM molecule and average percentage dwell time of the counter ions (Na+ and Ca2+) included in this simulation

Figure 3. Average of the radial distribution functions of the Ca2+ ions over the three runs performed for the G3.5 PAMAM dendrimer and Ca2+ system in water (top) and the Ca2+ and Na+ ions over the three runs performed for the G3.5 PAMAM dendrimer in a buffer solution (bottom).

Figure 3. Average of the radial distribution functions of the Ca2+ ions over the three runs performed for the G3.5 PAMAM dendrimer and Ca2+ system in water (top) and the Ca2+ and Na+ ions over the three runs performed for the G3.5 PAMAM dendrimer in a buffer solution (bottom).
Supplemental material

Supplementary_material.docx

Download MS Word (2.4 MB)