
Figures & data
Table 1. Ratio of gasoline–adulterant admixture prepared in the laboratory
Figure 1. Spectrum of pure gasoline (a), diesel (b), kerosene (c), premix (d), naphtha (e).
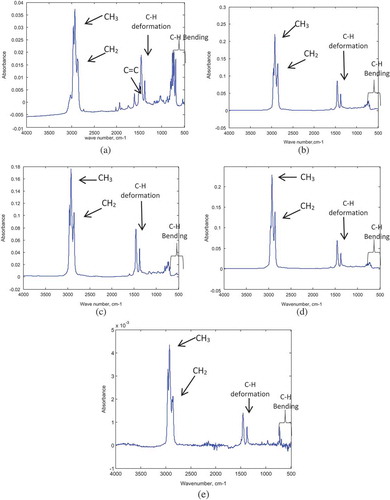
Figure 2. Spectra of gasoline–kerosene mixtures at different concentrations.
Samples GK1-GK10 are gasoline–kerosene admixtures with concentrations of kerosene from 5–50% v/v, respectively.
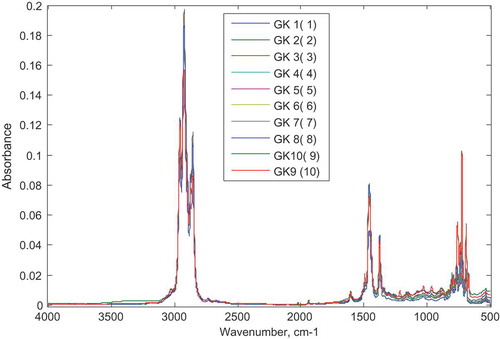
Figure 3. Spectra of gasoline-diesel mixtures at different concentrations.
Samples GD1-GD10 are gasoline–diesel admixtures with concentrations of diesel from 5–50% v/v, respectively.
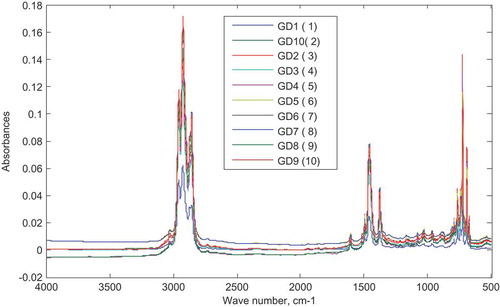
Figure 4. Spectra of gasoline–premix mixtures at different concentrations.
Samples GP1-GP10 are gasoline–diesel admixtures with concentrations of premix from 5–50% v/v, respectively
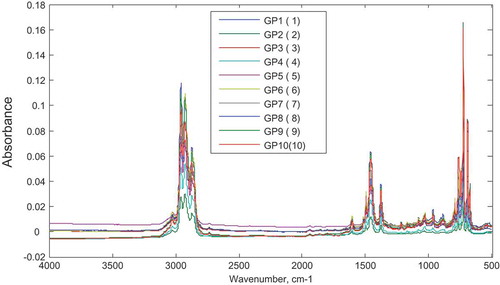
Figure 5. Spectra of gasoline–naphtha mixtures at different concentrations.
Samples GN1-GN10 are gasoline–diesel admixtures with concentrations of naphtha from 5–50% v/v, respectively.
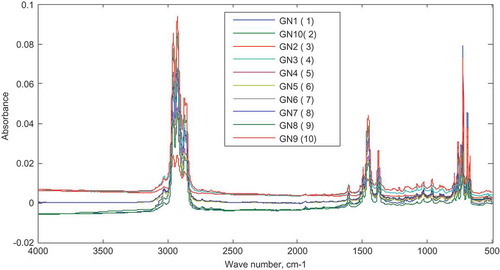
Figure 6. Spectra of calibration set for SIMCA model.
Samples with labels GD are adulterated with diesel, GK with kerosene, GP with premix and GN with L-naphtha.
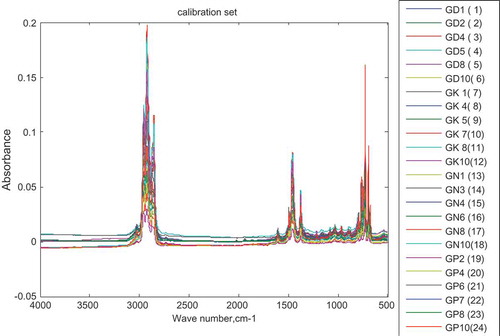
Table 2. Percent variance captured by PCA model–diesel class
Table 3. Percent variance captured by PCA model–kerosene class
Table 4. Percent variance captured by PCA model–naphtha class
Table 5. Percent variance captured by PCA model–premix class
Table 6. Confusion matrix (A) and confusion table (B) for the calibration set
Figure 7. Spectra of validation (test) set for SIMCA.
Samples with labels GD are adulterated with diesel, GK with kerosene, GP1 with premix and GN with L-naphtha
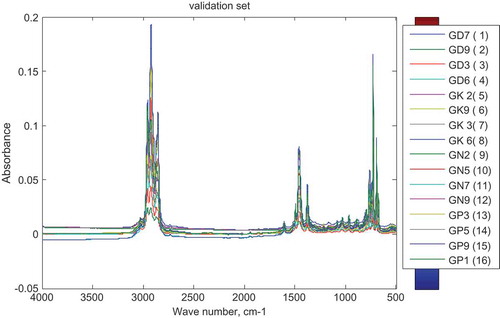
Table 7. Confusion matrix (A) and confusion table (B) for the validation set
Table 8. Actual and predicted adulterants present in validation set
Figure 8. Spectra of calibration data set for PLS-K.
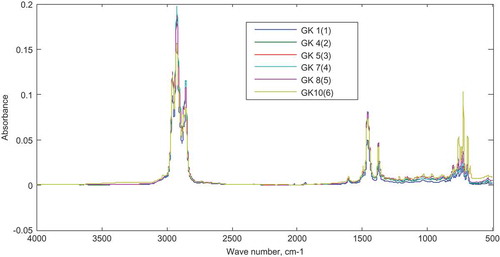
Table 9. Percent variance captured by regression model
Figure 9. Measured vs. predicted concentration of kerosene in the calibration set.
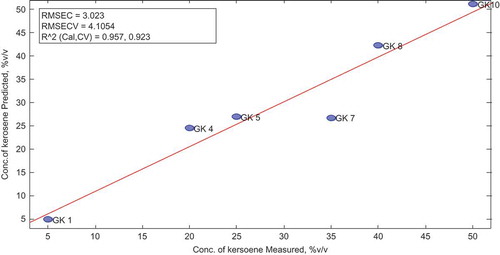
Table 10. Actual and predicted concentration of kerosene in calibration set
Figure 10. Actual vs. predicted concentration for the validation set (PLS-K).
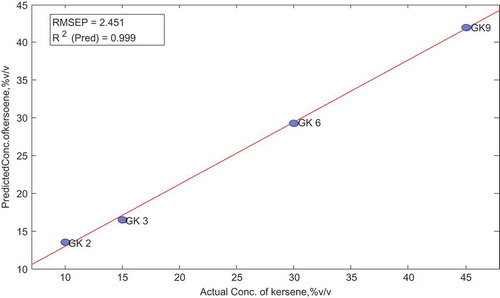
Table 11. Actual and predicted concentration of kerosene in validation set
Figure 11. Spectra of the calibration data set for PLS-D.
Samples GD1, GD2, GD4, GD5, GD8 and GD10 are adulterated gasoline with 5%, 10%, 20%, 25%, 40% and 50% v/v of diesel, respectively.
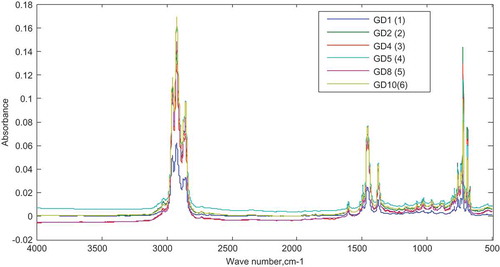
Figure 12. Actual vs. predicted concentration of diesel in calibration set (PLS-D).
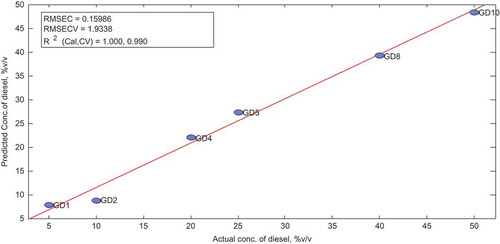
Figure 13. Actual vs. predicted concentration of diesel in the validation set.

Table 12. Comparison of actual and predicted diesel concentration in calibration set
Table 13. Comparison of actual and predicted diesel concentration in validation set
Figure 14. Spectra of (L) naphtha-adulterated gasoline samples (calibration set).
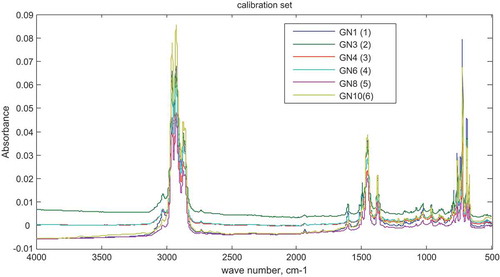
Table 14. Comparison of actual and predicted naphtha concentration in calibration set
Table 15. Comparison of actual and predicted naphtha concentration in validation set
Figure 15. Actual vs. predicted concentrations of naphtha in the calibration set.
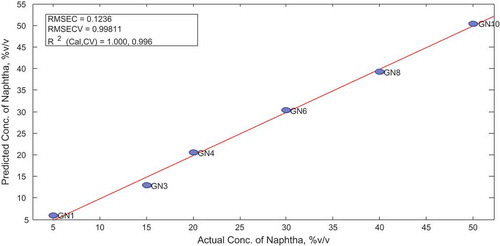
Figure 16. Actual vs. predicted concentration of naphtha (validation set).
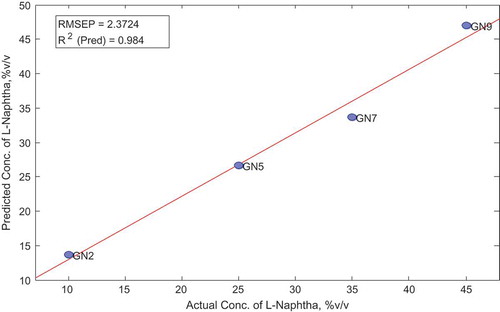
Table 16. Percent variance captured by regression model
Figure 17. Spectra of gasoline samples adulterated with premix (calibration set).
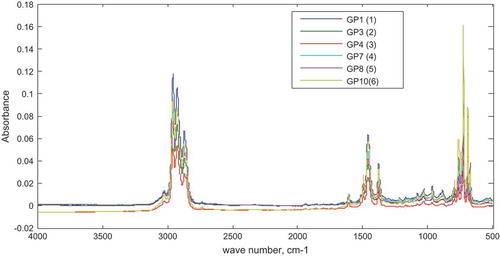
Figure 18. Actual vs. predicted concentration of premix (calibration set).
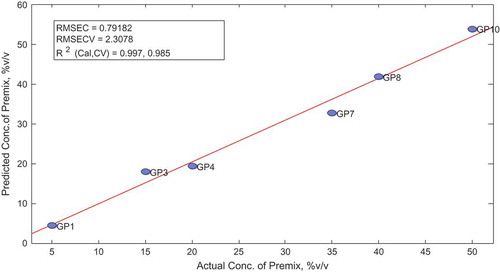
Figure 19. Actual vs. predicted concentration of premix (calibration set).
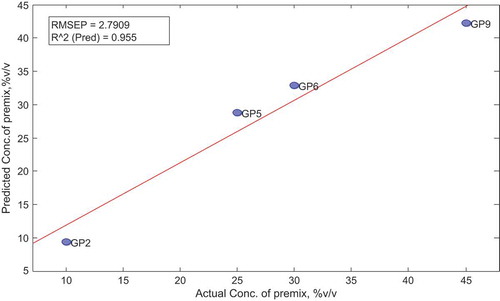
Table 17. Comparison of actual and predicted concentration of premix in calibration set
Table 18. Comparison of actual and predicted concentrations of premix in the validation set
Table 19. SIMCA classification of commercial samples based on adulterants present
Table 20. Quantity of adulterants in adulterated commercial gasoline samples