Figures & data
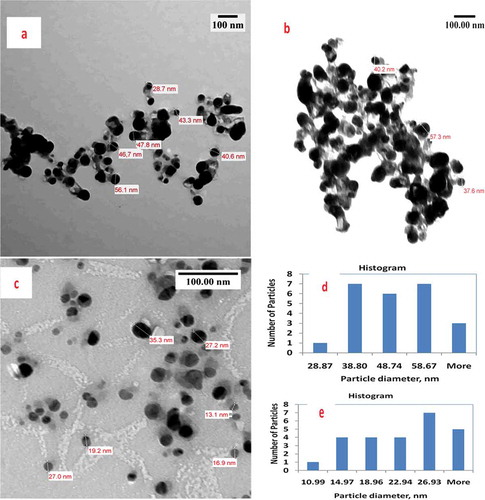
Figure 1. Fundamental active ingredients of Ph.L seeds and leaves (Abdel Aziz et al., Citation2010; Moloudizargari et al., Citation2013). General mechanism of bioreduction of Ag (I) ions to AgNPs by polyol biomolecules of plant extract (Das & Velusamy, Citation2013; Ghaedi et al., Citation2015).
Figure 2. UV-Vis spectra: (a) seed-AgNPs; (b) leaf- AgNPs and (c) comparison between leaf- and seed-AgNPs.
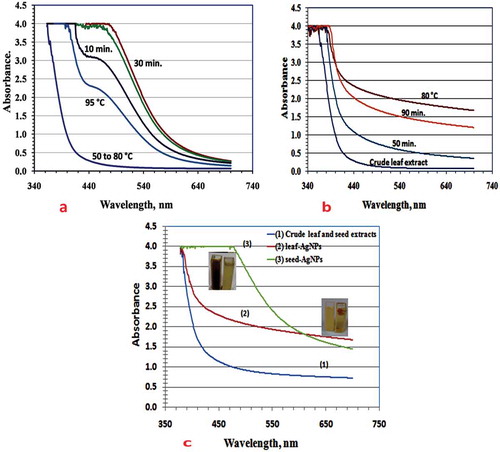
Figure 3. Comparative TEM study includes images, histogram and particle diameter distribution for: (a, b) leaf-AgNPs; (c) seed-AgNPs; (d) histogram of leaf-AgNPs, mean particle diameter = 52.6 nm, standard deviation = 14.51 & standard error = 5.48 and (e) histogram of seed-AgNPs, mean particle diameter = 24.2 nm, standard deviation = 6.97 and standard error = 2.2.

Figure 4. Comparative EDX patterns and FESEM images of seed-AgNPs (a, b) and leaf-AgNPs (c, d) showing shapes, exposing and hidden of AgNPs.
Figure 5. Comparative XRD patterns of seed-AgNPs (upper trace) and leaf-AgNPs (lower trace).
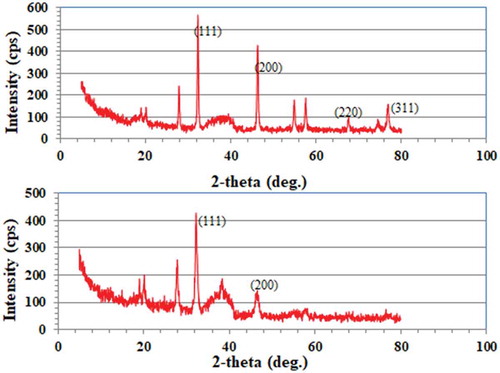
Figure 6. IR spectrum of crude extracts of seeds and leaves.
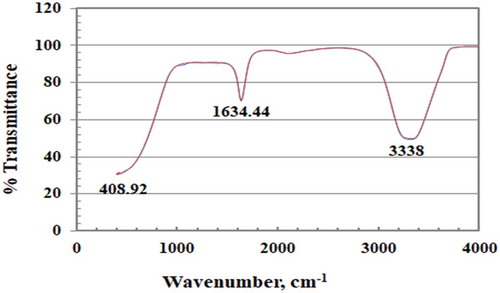
Figure 7. Comparative IR spectra of leaf-AgNPs (Upper trace) and seed-AgNPs (Lower trace) deposits.
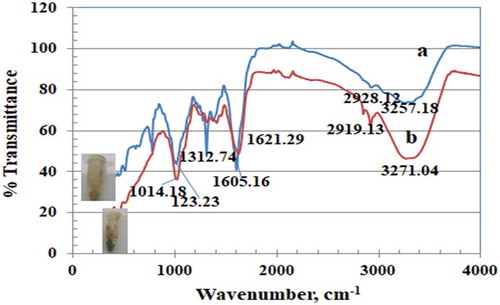
Table 1. Antibacterial activity of AgNPs against S. aureus and E. coli bacteria
Figure 8. Comparison between antibacterial activity of leaf (a) and seed (b) AgNPs against Staphylococcus aureus.
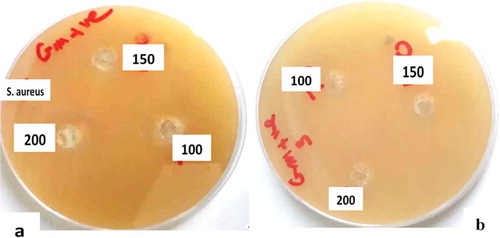
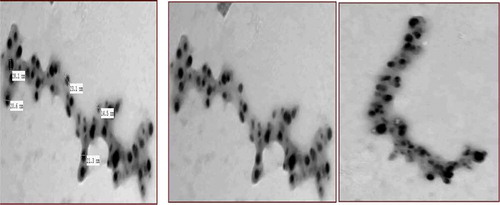
Figure 9. TEM image clarify the diffusion of seed-protected AgNPs to L-(+)-lysine functional groups (2 ml 200μg/ml of seed-AgNPs in 80 mg L-lysine:10 ml water).