Figures & data
Table 1. Bias data of blood spiked with ethanol and IS at three concentration levels
Figure 1. Calibration curve after removal of outlier (2 mg/mL; 0.089416213): RPA(Y) = 0.46*Conc. (mg/mL)- 0.0639
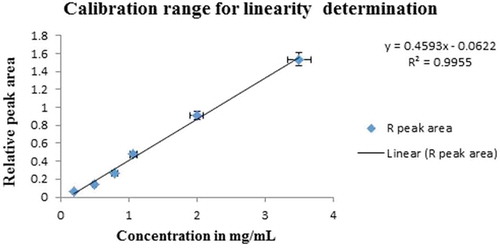
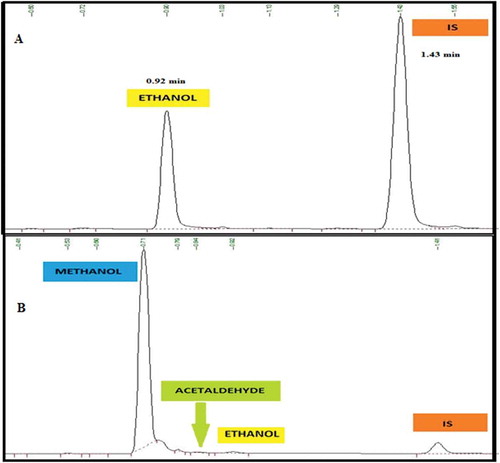
Figure 2. (a) shows chromatogram of Ethanol and IS at the same concentration 0.8 mg/mL and (b) shows spiked human blood containing 0.8 mg/mL methanol, 80 mg/mL acetaldehyde, 0.8 mg/mL ethanol and 0.8 mg/mL IS

Table 2. Statistical evaluation for repeatability and intermediate precision between two analysts