825
Views
2
CrossRef citations to date
0
Altmetric
Research Article

Effects of a microbial pigment violacein on the activities of protein kinases

, , & | (Reviewing Editor)
Article: 1259863 | Received 09 Sep 2016, Accepted 04 Nov 2016, Published online: 28 Nov 2016

Figures & data

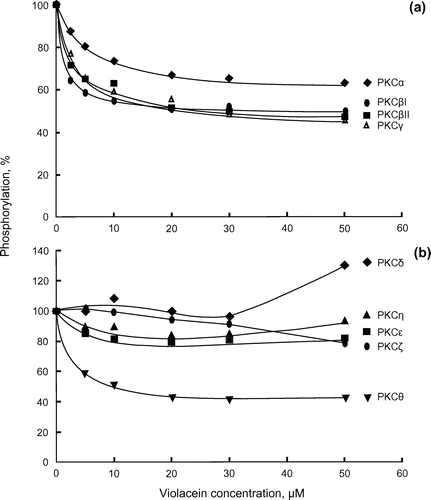
Figure 1. Inhibition of a subfamily of PKC enzymes by violacein. (a) Classical-type recombinant PKCs (α, βI, βII and γ, 7.5 ng of each) were assayed at 30°C for 10 min. Phosphorylations in the absence of violacein were 0.63 (PKCα), 0.34 (PKCβI), 0.76 (PKCβII) and 0.38 (PKCγ) nmol Pi, respectively. (b) Novel and atypical recombinant PKCs (δ, ε, θ, η and ζ, 6.6 ng of each) were assayed at 30°C for 10 min. Phosphorylations in the absence of violacein were 0.023 (PKCδ), 0.13 (PKCε), 0.020 (PKCη), 0.095 (PKCθ) and 0.13 (PKCζ) nmol Pi, respectively.
Note: The data represent mean enzyme activity values in duplicate or triplicate assays within the 10% error margin.
Figure 1. Inhibition of a subfamily of PKC enzymes by violacein. (a) Classical-type recombinant PKCs (α, βI, βII and γ, 7.5 ng of each) were assayed at 30°C for 10 min. Phosphorylations in the absence of violacein were 0.63 (PKCα), 0.34 (PKCβI), 0.76 (PKCβII) and 0.38 (PKCγ) nmol Pi, respectively. (b) Novel and atypical recombinant PKCs (δ, ε, θ, η and ζ, 6.6 ng of each) were assayed at 30°C for 10 min. Phosphorylations in the absence of violacein were 0.023 (PKCδ), 0.13 (PKCε), 0.020 (PKCη), 0.095 (PKCθ) and 0.13 (PKCζ) nmol Pi, respectively.

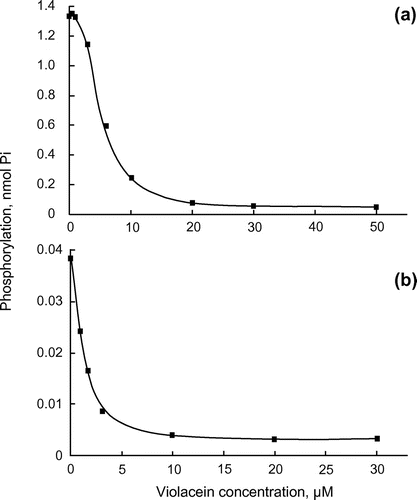
Figure 2. Inhibition of the catalytic subunits of PKA and PKC by violacein. (a) Catalytic subunits of PKA (1 unit) and (b) PKC (2.1 ng) were assayed at 30°C for 10 and 20 min, respectively, in the presence of the indicated concentrations of violacein.
Note: The data represent mean enzyme activity values in duplicate or triplicate assays within the 10% error margin.
Figure 2. Inhibition of the catalytic subunits of PKA and PKC by violacein. (a) Catalytic subunits of PKA (1 unit) and (b) PKC (2.1 ng) were assayed at 30°C for 10 and 20 min, respectively, in the presence of the indicated concentrations of violacein.

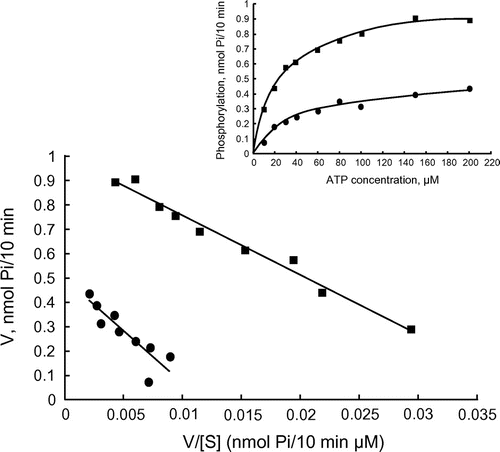
Figure 3. Enzyme kinetics of the PKA catalytic subunit. Eadie–Hofstee plot of kinetic experiments with PKA. PKA was assayed without violacein (closed square) and in the presence of 6-μM violacein (closed circle).
Note: The data represent mean enzyme activity values in duplicate or triplicate assays within the 10% error margin.
Figure 3. Enzyme kinetics of the PKA catalytic subunit. Eadie–Hofstee plot of kinetic experiments with PKA. PKA was assayed without violacein (closed square) and in the presence of 6-μM violacein (closed circle).

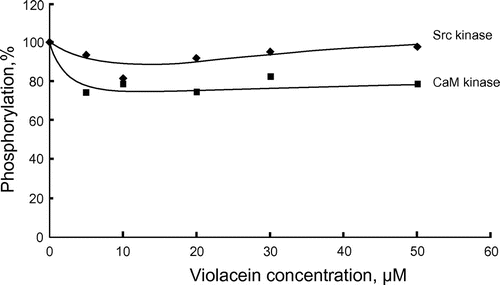
Figure 4. Effects of violacein on Src kinase and CaM kinase. Src kinase (20 ng) and CaM kinase (15 ng) were assayed at 30°C for 20 min. Phosphorylations in the absence of violacein were 0.047 (Src kinase) and 0.54 (CaM kinase) nmol Pi, respectively.
Note: The data represent mean enzyme activity values in duplicate or triplicate assays within the 10% error margin.
Figure 4. Effects of violacein on Src kinase and CaM kinase. Src kinase (20 ng) and CaM kinase (15 ng) were assayed at 30°C for 20 min. Phosphorylations in the absence of violacein were 0.047 (Src kinase) and 0.54 (CaM kinase) nmol Pi, respectively.