2,107
Views
6
CrossRef citations to date
0
Altmetric
Research Article

Differential biochemical response of rice (Oryza sativa L.) genotypes against rice blast (Magnaporthe oryzae)

, , ORCID Icon, & ORCID Icon | (Reviewing Editor)
Article: 1264162 | Received 26 Oct 2015, Accepted 03 Nov 2016, Published online: 16 Jan 2017

Figures & data

Table 1. Grade description for screening against M. oryzae

Table 2. Chromosome location (CL), size range (SR), primers sequence and annealing temperature (AT) for two SSR markers used in the study

Table 3. Leaf blast severity were recorded by following 0–9 SES scale as per IRRI, Philippines

Figure 1. Activity profile of superoxide dismutase (SOD).
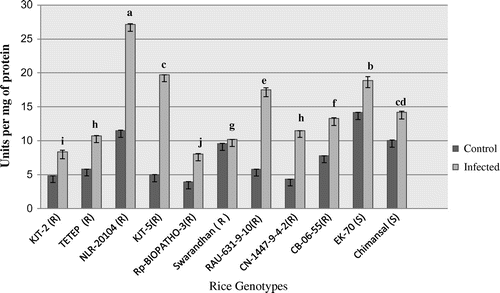
Notes: The vertical bar in the figures indicates activity profile of antioxidative enzymes from disease free (control) and after challenge to inoculation with M. oryzae (infected) leaf samples of 11 rice genotypes. The bar indicates SE ± of mean (n = 3) at p < 0.05 probability.
Figure 1. Activity profile of superoxide dismutase (SOD).

Figure 2. Activity profile of peroxidase (POX).
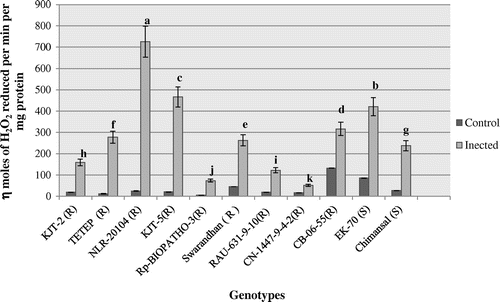
Notes: The vertical bar in the figures indicates activity profile of antioxidative enzymes from disease free (control) and after challenge to inoculation with M. oryzae (infected) leaf samples of 11 rice genotypes. The bar indicates SE ± of mean (n = 3) at p < 0.05 probability.
Figure 2. Activity profile of peroxidase (POX).

Figure 3. Activity profile of ascorbate peroxidase (APX).
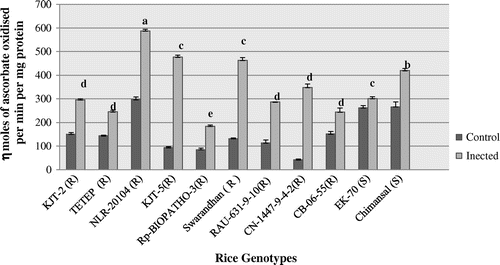
Notes: The vertical bar in the figures indicates activity profile of antioxidative enzymes from disease free (control) and after challenge to inoculation with M. oryzae (infected) leaf samples of 11 rice genotypes. The bar indicates SE ± of mean (n = 3) at p < 0.05 probability.
Figure 3. Activity profile of ascorbate peroxidase (APX).

Figure 4. Activity of phenylalanine ammonia lyase (PAL).
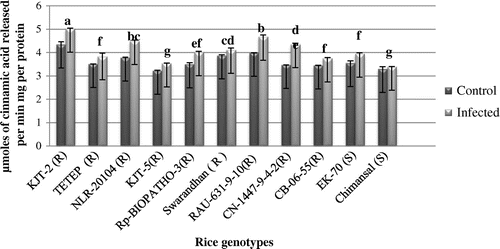
Notes: The vertical bar in the figures indicates activity profile of defense-related enzymes from disease free (control) and after challenge to inoculation with M. oryzae (infected) leaf samples of 11 rice genotypes. The bar represent standard error of mean (n = 3) at p < 0.05 probability.
Figure 4. Activity of phenylalanine ammonia lyase (PAL).

Figure 5. Activity of Chitinase.
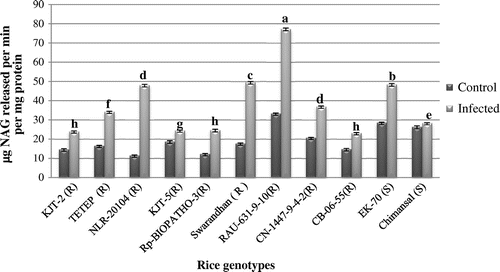
Notes: The vertical bar in the figures indicates activity profile of defense-related enzymes from disease free (control) and after challenge to inoculation with M. oryzae (infected) leaf samples of 11 rice genotypes. The bar represent standard error of mean (n = 3) at p < 0.05 probability.
Figure 5. Activity of Chitinase.

Figure 6. Activity of β-glycosidase.
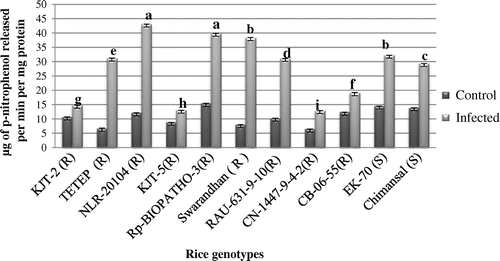
Notes: The vertical bar in the figures indicates activity profile of defense-related enzymes from disease free (control) and after challenge to inoculation with M. oryzae (infected) leaf samples of 11 rice genotypes. The bar represent standard error of mean (n = 3) at p < 0.05 probability.
Figure 6. Activity of β-glycosidase.

Figure 7. The purified genomic DNA was quantified and equal amount of DNA was used for PCR amplification. (a) Amplified genomic DNA of blast resistant and susceptible genotypes with SSR primer RM 224 and (b) with SSR RM144. The Lane M:100 bp, lane 1:1-KJT-2 (R),Lane 2:KJT-5 (R), Lane 3-TETEP (R), Lane 4:Chimansal(S), Lane 5:NLR-20104 (R),Lane 6:-EK-70 (S).
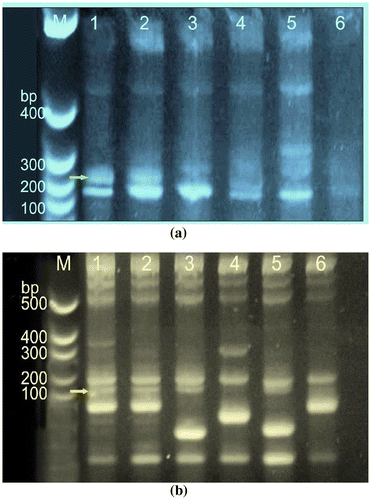
Figure 7. The purified genomic DNA was quantified and equal amount of DNA was used for PCR amplification. (a) Amplified genomic DNA of blast resistant and susceptible genotypes with SSR primer RM 224 and (b) with SSR RM144. The Lane M:100 bp, lane 1:1-KJT-2 (R),Lane 2:KJT-5 (R), Lane 3-TETEP (R), Lane 4:Chimansal(S), Lane 5:NLR-20104 (R),Lane 6:-EK-70 (S).
Supplemental material

Table_4_supplimentary_information_table.docx

Download MS Word (25 KB)